19-01-2024 - Physics - The state diagram [EN]-[IT]
~~~ La versione in italiano inizia subito dopo la versione in inglese ~~~
ENGLISH
19-01-2024 - Physics - The state diagram [EN]-[IT]
The state diagram
Let's consider the following system
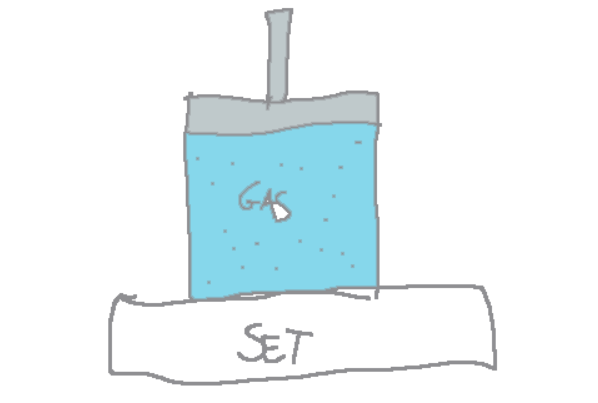
In this system we have an ideal gas in a piston. The temperature of the gas is at a constant temperature. The lower part is in contact with a thermal reservoir which is at a certain temperature T.
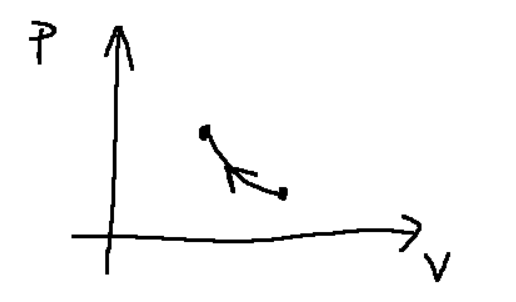
If we start adding weights so that the piston moves down in a p-v graph we will start to see an isothermal thermodynamic transformation, see example below.
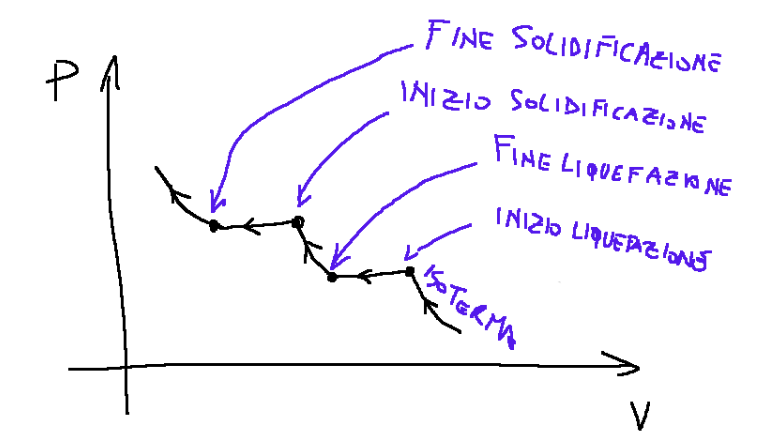
Subsequently, the pressure growth will stop and drops of liquid will appear in the piston. At this moment a change of state will occur, from the gaseous state to the liquid state. Now the pressure will remain constant.
If you continue to add weight you will go completely into the liquid state and by continuing to add weight the pressure will rise again and the volume will decrease.
As you continue to add weights, the first solid crystals will begin to appear. By continuing to compress the pressure becomes constant again while the new change in state occurs. The solid state will be reached.
The graph will look like this
If we represent all the possible transformations in the p-v plane, we have a graph like the one shown below.
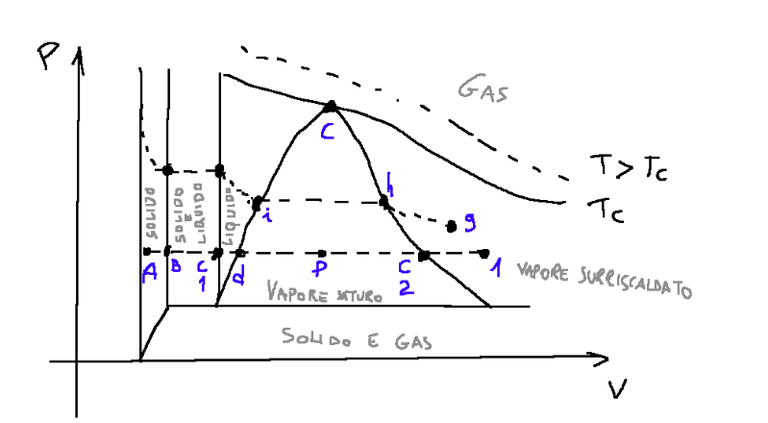
From this graph we note that along the high isothermal transformations the saturated vapor phase does not occur, but from the vapor state we pass directly to the liquid state. This happens for the isotherm at temperature Tc and is called critical temperature, while point C is called critical point and its relative pressure is called critical pressure (p c)
CONCLUSION
With the state or phase diagram we can know what phase the system is in, that is, whether it is in the gas, liquid or solid state.
Request
Have you ever tried to draw state diagrams?

19-01-2024 - Fisica - Il diagramma di stato [EN]-[IT]
Il diagramma di stato
Prendiamo in considerazione il seguente sistema

In questo sistema abbiamo un gas ideale in un pistone. La temperatura del gas è ad una temperatura costante. La parte inferiore è a contatto con un serbatoio termico che si trova ad una determinata temperatura T.
Se iniziamo ad aggiungere pesi in maniera che il pistone si abbassi in un grafico p-v inizieremo a vedere una trasformazione termodinamica isoterma, vedi esempio qui sotto.

In seguito avverrà che la crescita della pressione si arresterà e nel pistone appariranno gocce di liquido. In questo momento avverrà un cambiamento di stato, dallo stato gassoso si passerà a quello liquido. Ora la pressione rimarrà costante.
Se si continua ad aggiungere peso si passerà totalmente allo stato liquido e continuando ad aggiungere pesi la pressione tornerà a salire ed il volume a diminuire.
Continuando ad aggiungere pesi inizieranno a comparire i primi cristalli di solido. Continuando a comprimere la pressione torna di nuovo ad essere costante mentre avverrà il nuovo cambiamento di stato. SI raggiungerà lo stato solido.
Il grafico avrà questo aspetto

Se andiamo a rappresentare nel piano p-v tutte le trasformazioni possibili, si ha un grafico tipo quello qui sotto rappresentato.

Da questo grafico notiamo che lungo le trasformazioni isoterme alte non si verifica la fase di vapore saturo, ma dallo stato di vapore si passa direttamente allo stato liquido. Questo accade per l’isoterma a temperatura Tc e viene chiamata temperatura critica, mentre il punto C viene chiamato punto critico e la sua relativa pressione viene chiamata pressione critica (p c)
CONCLUSIONE
Con il diagramma di stato o di fase possiamo conoscere in che fase è il sistema, cioè se è nello stato gasso, liquido o solido.
Domanda
Avete mai provato a tracciare dei diagrammi di stato?
THE END
Thanks for the physics lesson on state diagrams. I think I have attempted the drawing of such diagrams back in my secondary school days though I wasn't a physics student back then. Have a great day.
The state diagram helps us understand whether we are in the solid, liquid or gaseous phase
I understand this state much more better right now
when I reread it I realized that I could explain it better
The diagrams are really helpful
Thanks for the lecture
It was nice!
Thank you for always being present on my blog. Drawing this diagram freehand was difficult
i didn't try to draw state diagrams.
I admit that I struggled a little to draw this pressure-volume graph... in reality I could have made it even more complete
No, non ne ho mai fatto uno simile
Un diagramma di stato o diagramma di fase è un diagramma cartesiano riferito ad una sostanza pura o ad una miscela, che rappresenta lo stato del sistema termodinamico.