Hive price has halt in the big support zone. Buyers are about to push. Here is my take.
Crypto Analysis #7
HIVEUSDT price action chart analysis
Hello there, @tradersaan is here, hope you all are doing very well. Today I am going to share the technical analysis of HIVEUSDT because I have found a beautiful buy zone in the technical chart so far. By the way I take trade in MT4 and Binance and do the chart analysis in Tradingview.
I will go through price action in multiple timeframe perspective and will tell about my short and long term approach to the market.
Disclaimer: This post is not a trading mantra or get rich quick method, it is made only for educational purpose. I truely want to help others who want to learn Forex and Crypto trading and investing. Trading in the financial markerts involvs a lots of risk. I don't sell signal and don't recommend anybody to do signal trade. Sit back, do your own analysis and if you feel confidence, only then go ahead. Trading in the financial markets is a get rich slow and consistent process. It demands patience & long-term projection and hard work. So be aware of social media scammers.
Daily Chart
Many of you who are trading in short term may find that the HIVEUSDT is in downtrend from april,2022. But I want to warn them for considering it a downtrend as the price has come to a big support zone in the daily chart. As you see the chart below, the drawn support zone have been a crucial zone as whenever the price has come to this level, it has drastically move up - buyers percieve it as a discounted price. And the price has got a bit rejection yesterday which makes the wick of the yesterday's bull candle.
So my take is that this zone is to be considered as a buy entry zone for long term like next one or two month if further things come up in the price action. And if the price breaks this support to the downside, then my long bias will be changed as that will be considered as seller's pressure and I want to see myself with the flow. Then I will look for a short entry there. So, in this particular long trade, my stop loss will be below the market structure,i.e., below the drawn support zone while the target profit will be at around 1.2500 level.
HIVEUSDT, D1, the price is in a big support zone, could find buyers

Image source: tradingview, prepared by me
Four Hourly Chart
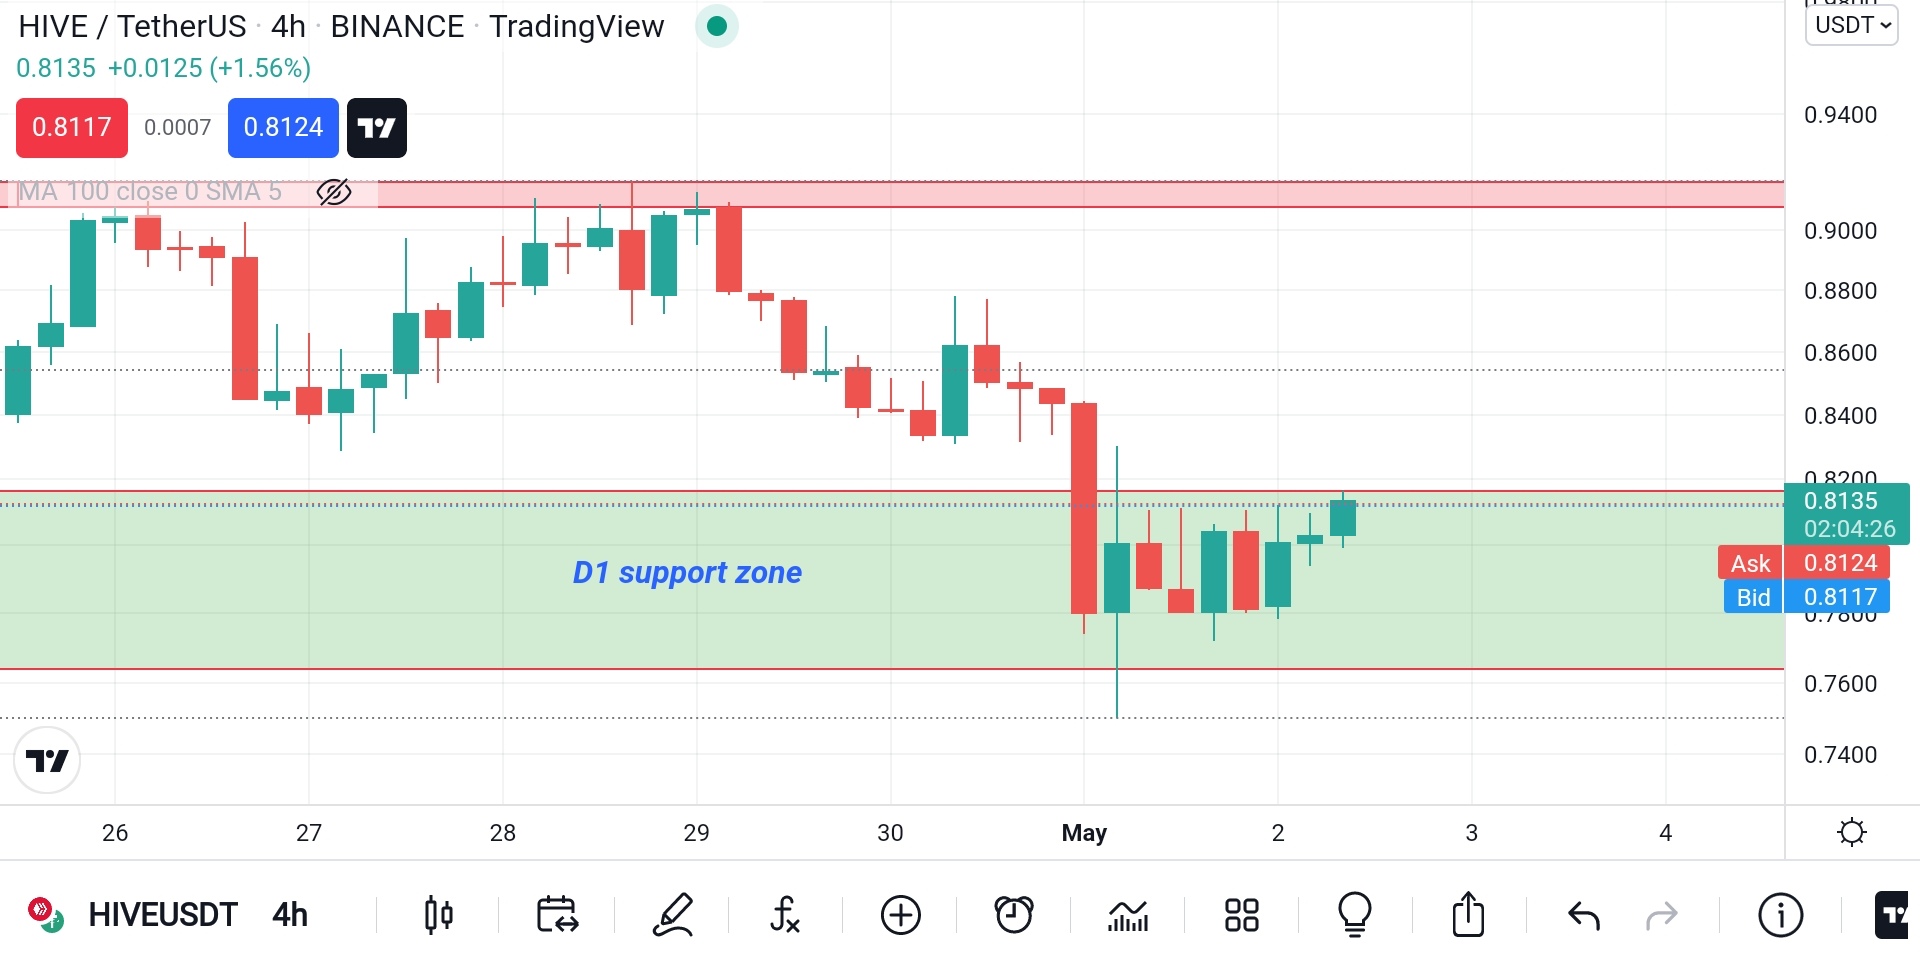
In H4 timeframe, the price has been in the downtrend from april, and after the seller rally the price is consolidating in the D1 support zone. This means that the sellers are losing control and meanwhile the buyers are stepping into the market, this two scenarios make the market in a consolidation zone which can be seen in the range bound market in the lower timeframe. And as the support zone is in daily timeframe, the consolidation period can be held for somedays. Also if you have a closer look the candlesticks, you may find some bullish formation like engulfing and dark cloud cover.
HIVEUSDT, H4, the price is consolidating in the D1 support zone

Image source: tradingview, prepared by me
Hourly Chart
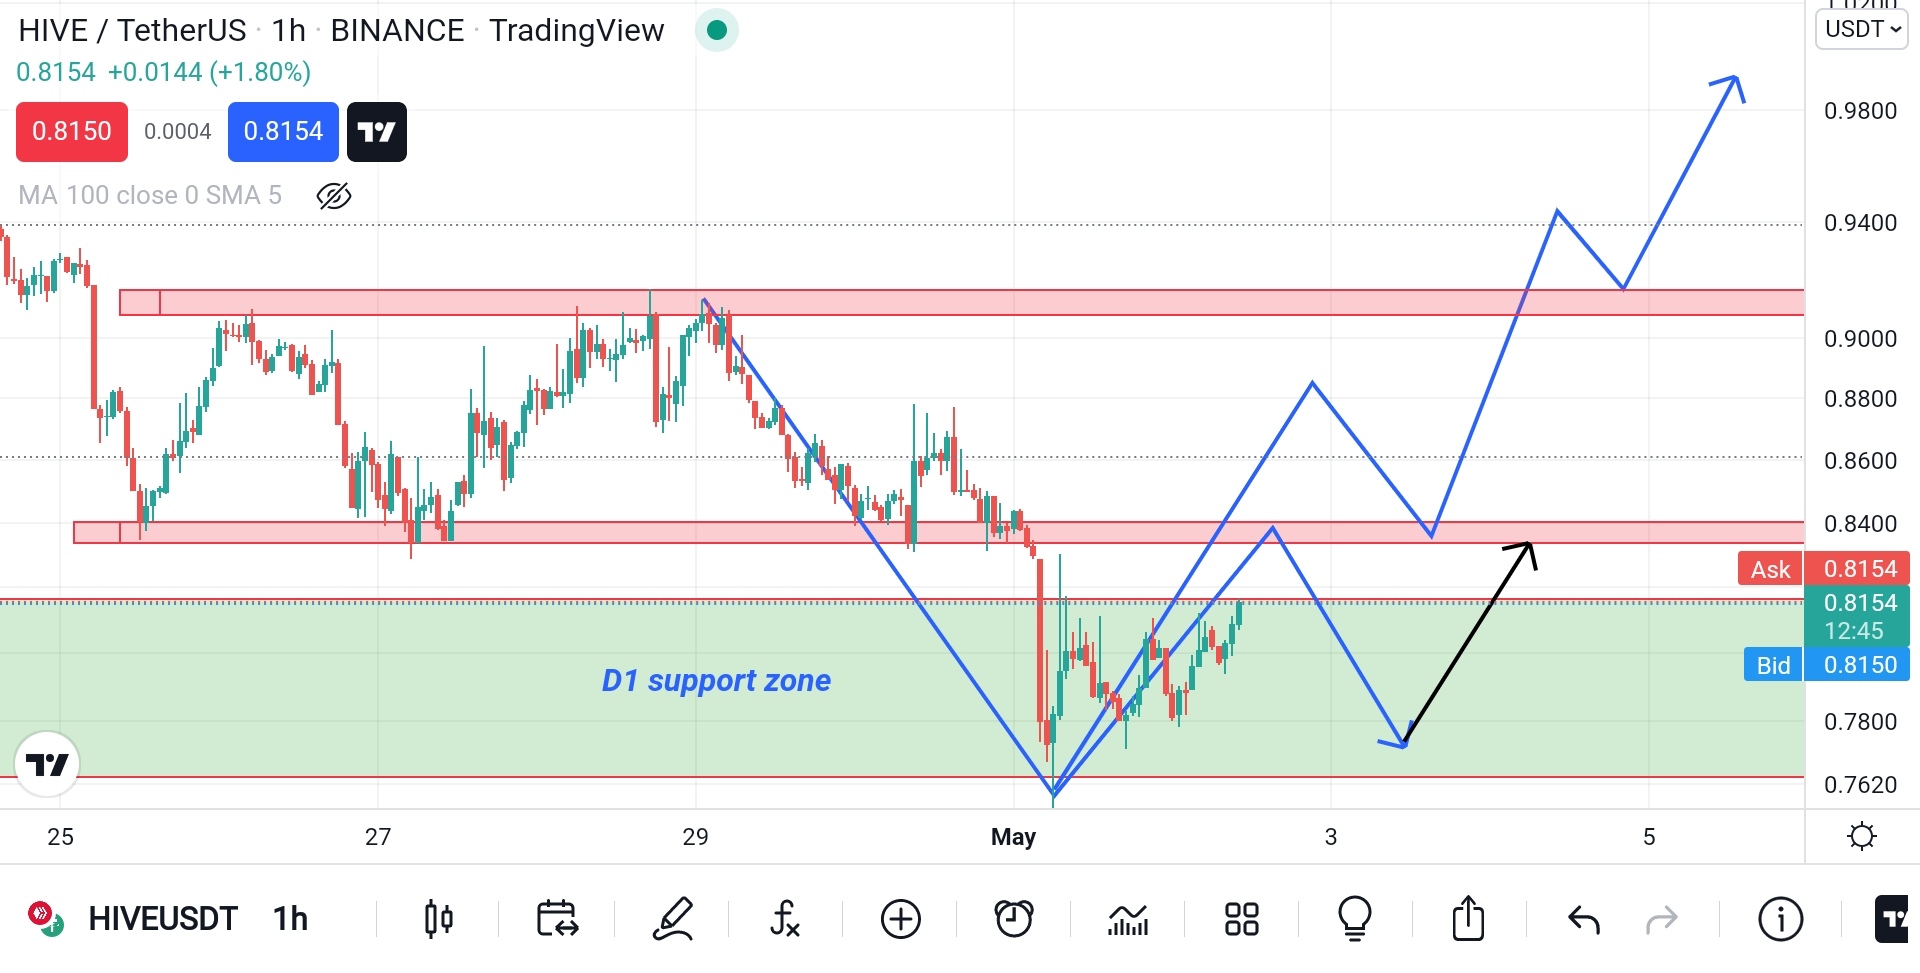
As I said earlier, the consolidation of the bigger timeframe makes support-resistance bounded market in the lower timeframe. In H1, you see below that the price has broken a minor support and and has come to the D1 support zone and currently is marching towards the broken H1 support.
For those who are short term trader, may find this broken support(which has become minor resistance zone) as a good sell entry zone, but the target profit should be at the D1 support, so the risk to reward ratio wouldn't be that good for this particular short trade setup.
My take here is that if the price breaks the minor resistance zone to the upside, then in the pullback move I will put a buy entry there while my stop loss will be below that broken resistance zone and I would love to keep my tp open, as I am fond of trailing my stop loss which increases the chance of getting big moves often. But if the price breaks the D1 support, I will change my long bias and will look for short setup.
HIVEUSDT, H1, waiting for buy setup, as it is shown in the chart

Image source: tradingview, prepared by me
30 Minutes Chart
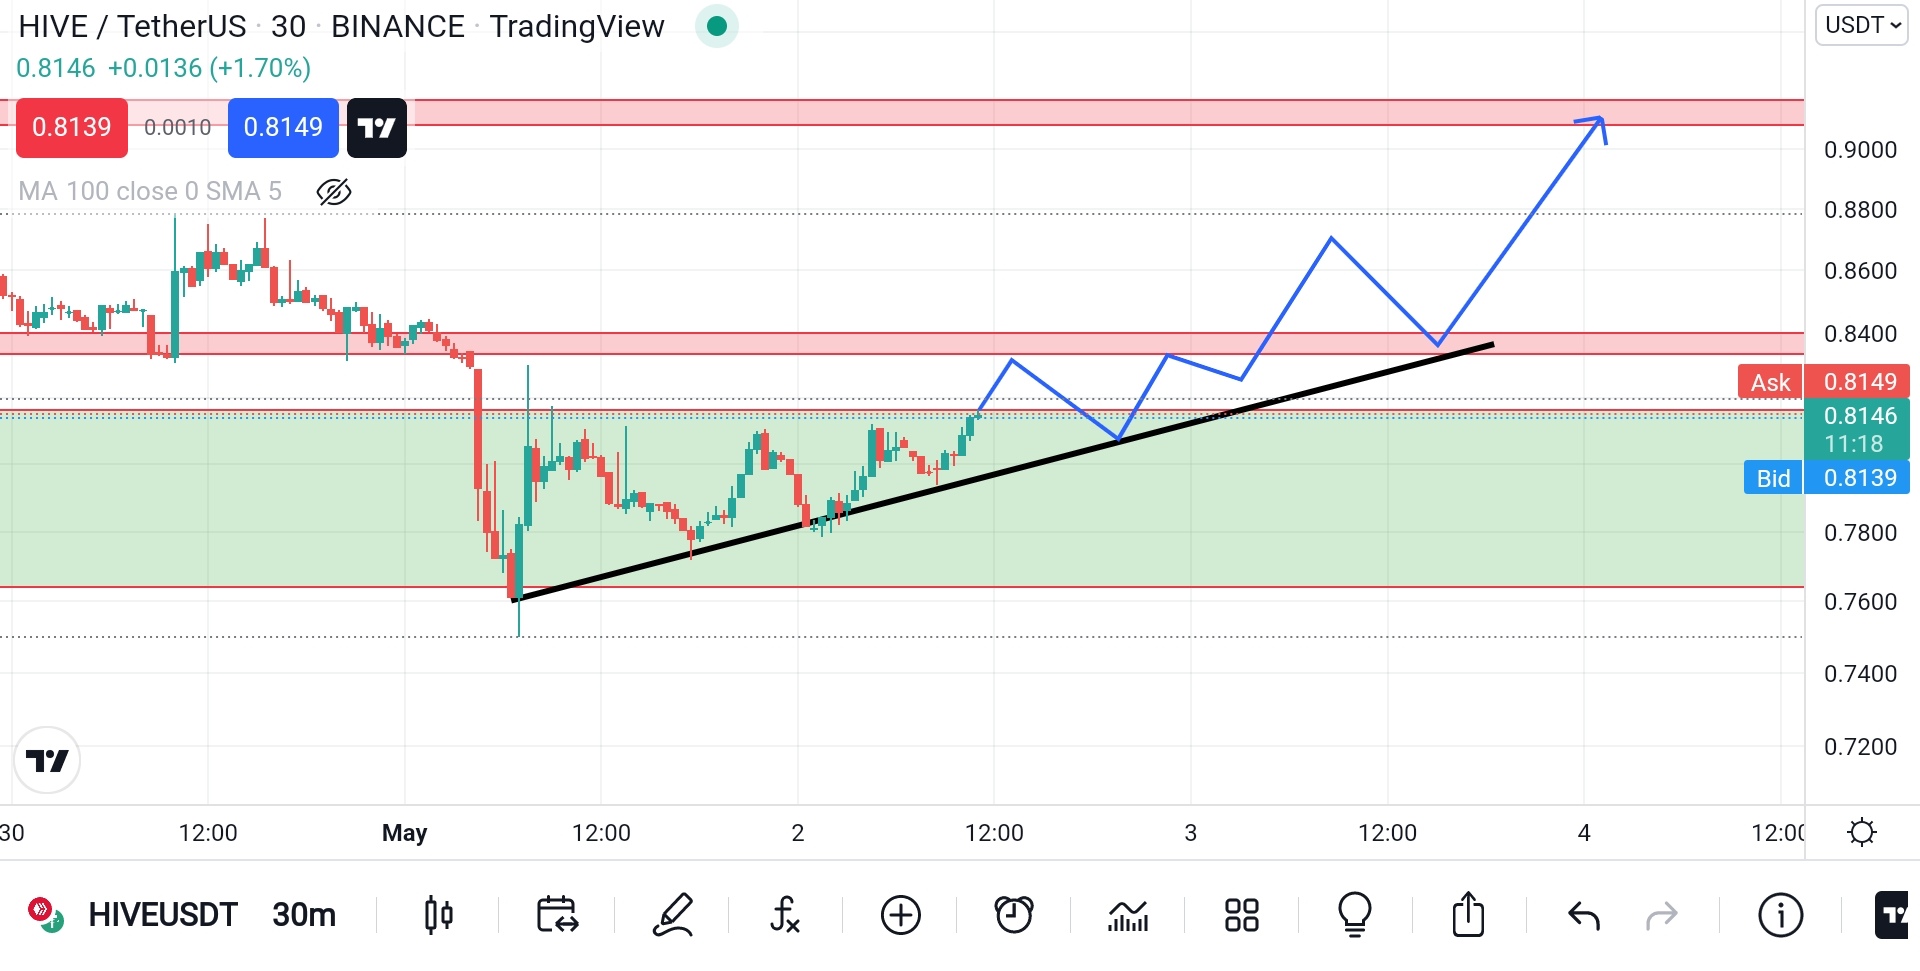
In M30, the price is marching higher while making higher highs and lower highs and supporting by a nice uptrendline. The buyers of big timeframe have already started to come in the market. And those bulls are winner then a big rally to the upside can be seen in the HIVEUSDT chart.
I will enter a buy entry if the price breaks the H1 resistance zone which is at around 0.8400 level. So in the breakout pullback move, I will jump into the market for a long position. My stop loss will be relatively tight and just below the broken resistance zone while I will keep my target profit open and will be trailing my stop loss in the profit side if the market goes in my favour.
HIVEUSDT, M30, the price is supported by an uptrendline

Image source: tradingview, prepared by me
The final words: I am bullish on the HIVEUSDT pair, and I will look for only buy setup in this pair untill the price doesn't break the D1 support zone. And also I will keep my ear open for the fundamental parts - for just increasing my trading odds. Anyway do your analysis and share it to the comment section
Well guys, this wraps up for today. Hope it helps.
Feel free to comment what you feel about this pair and it will be really great if you show some supports by giving me up-votes.
Thank you so much if you make it to the end. See you in my next post.
Thanks!!!
By @tradersaan
This post has been manually curated by @bhattg from Indiaunited community. Join us on our Discord Server.
Do you know that you can earn a passive income by delegating to @indiaunited. We share 100 % of the curation rewards with the delegators.
Here are some handy links for delegations: 100HP, 250HP, 500HP, 1000HP.
Read our latest announcement post to get more information.
Please contribute to the community by upvoting this comment and posts made by @indiaunited.
Thank you so much
Nice insight bro. This zone is very important. I think hivers should consider to hold their HBD from withdrawing as the HIVE price is likely to go up
Yes bro. This zone is important both long and short term trader. Bitcoin has become the official currency in central africa which is a great start of the crypto explosion. Hope HIVE values is likely to increase sooner or later. Now it is time to invest in the crypto market as well as HIVE
Hi @tradersaan,
I was reading your post with interest and much-needed motivation, But I gave up as soon as the chart popped up on the page.
Hahaha, I guess I still have a lot to learn before going in deep and understanding the rule of this game.
But still, the fact that I even tried reading the post even after seeing the scary thumbnail says that I am doing better than before.
Cheers Friend.
☮♥
thanks for dropping by brother. yes, i think you are not aware of trading stuff, but you have shown patience by reading even if you didnt undrstand the context which shows your interest in trading. I try to regularly upload trading stuff, day by day I will upload the whole concept for those who want to learn crypto trading. so stay tunned and thanks for commenting brother
Congratulations @tradersaan! You have completed the following achievement on the Hive blockchain and have been rewarded with new badge(s):
Your next target is to reach 100 upvotes.
You can view your badges on your board and compare yourself to others in the Ranking
If you no longer want to receive notifications, reply to this comment with the word
STOPTo support your work, I also upvoted your post!
Check out the last post from @hivebuzz:
Support the HiveBuzz project. Vote for our proposal!