Crypto Analysis | Hive Pump Confirmed!
Good day Hiveians!
Join me in analyzing the crypto markets!
I think I should make these posts premium after I seem to be able to predict Hive's price now 😅
Just 2 days ago I anticipated the next Hive pump, although I did not expect it so soon. Since this post apparently was so good I'll recap a bit.
Note, I also predicted the previous pump 3 weeks ago, see here!
Two things I think are important.
- We identified that we are again in an active phase, i.e., impulse wave which will see this type of behavior more often.
Note the first big volume pump on the right side which signals this (of which there is a second one now)
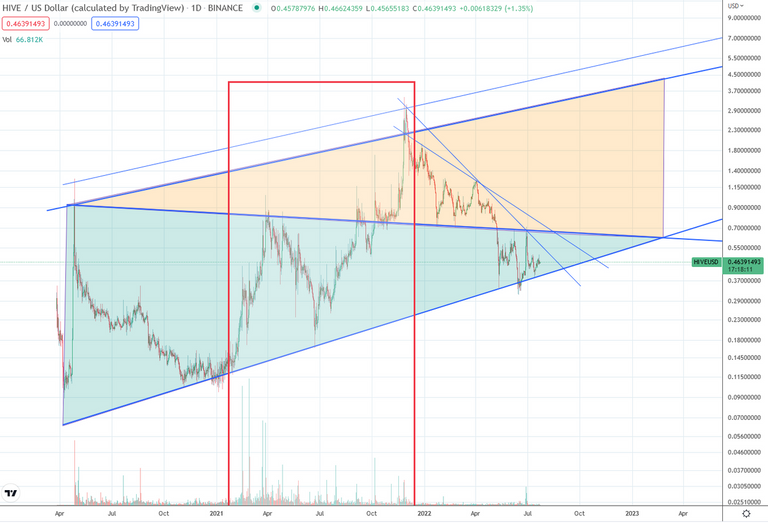
- We then calculated the mean and range for these pumps.
This means that on average we had a pump every 16.25 days in 2021 with the longest interval being 37 days.
Just 27 days later we get this next pump. So it seems this calculation was pretty good!
Let's have a look at the depth charts
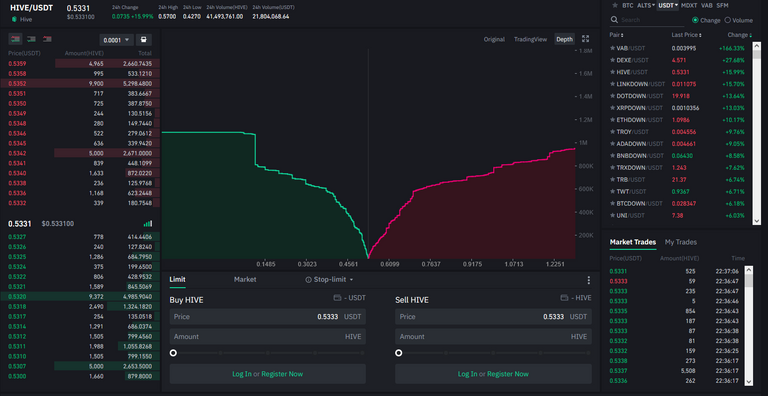
Some days ago I pointed to the fact that the order book was very skewed towards the selling side. I couldn't find a single coin with the ratio of selling orders so much higher than the buying orders. This is problematic as it is hard to push through all of these sell orders. But we also said that the market is very dynamic and things shift fast. With this latest pump the depth chart is much more evenly distributed. But it took a while to get there. So here is a bit of an in depth look:
This is Hive at the beginning of the pump
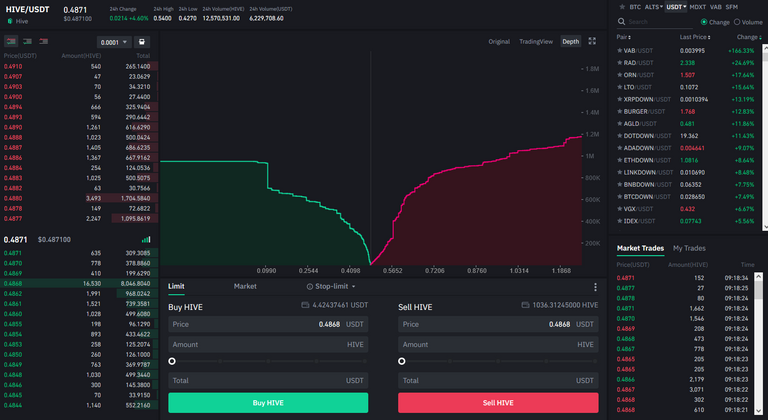
A close up reveals the obvious buying pressure.
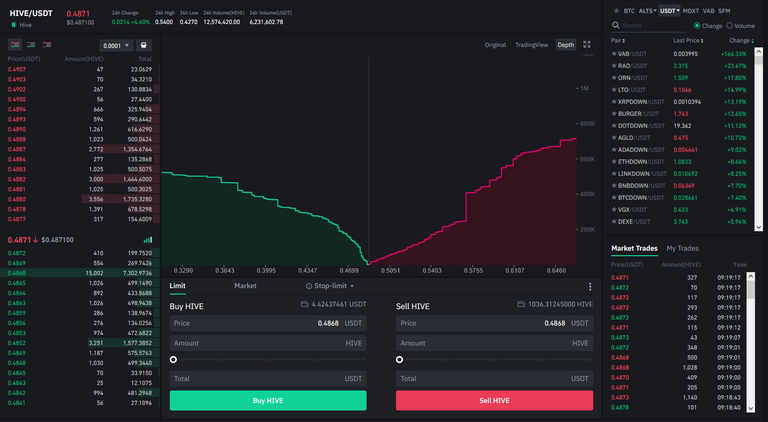
The we hit an $80k sell wall at 55 cents.
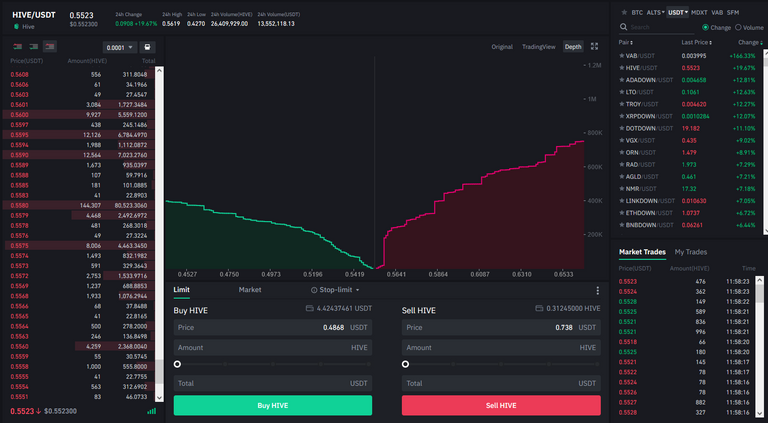
Which shifts up
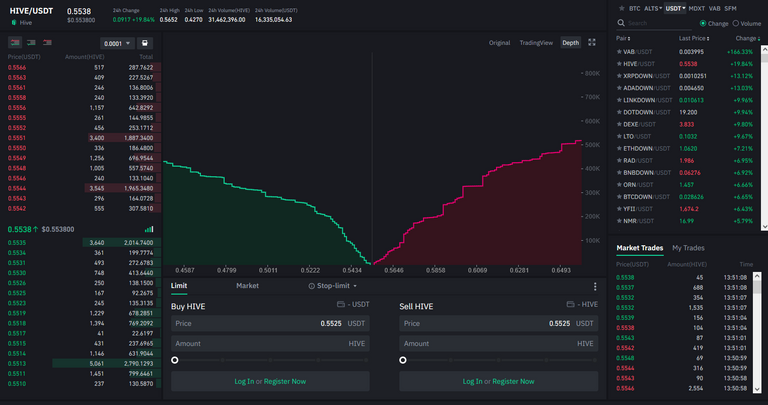
Notice how the buying orders keep getting bigger. This is at the max zoom out scale.
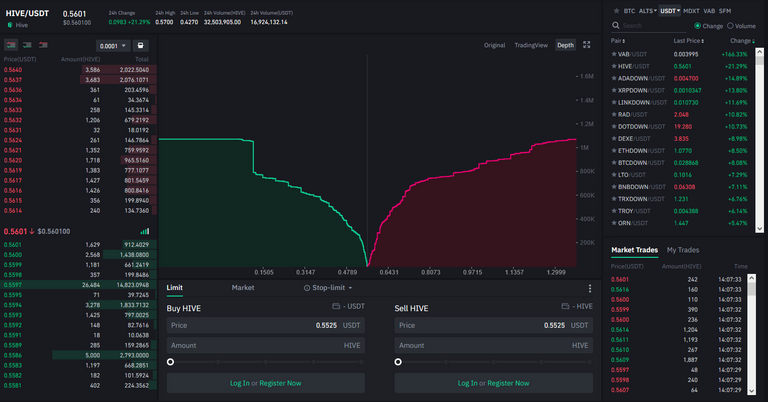
This pump is much more sustained than last ones. Look at the volume which is much higher accumulated (although the peaks are higher on the left).
We now have an equally distributed order book again. This is great news in my opinion as this leaves the door open for a bigger push upwards.
Now the charts
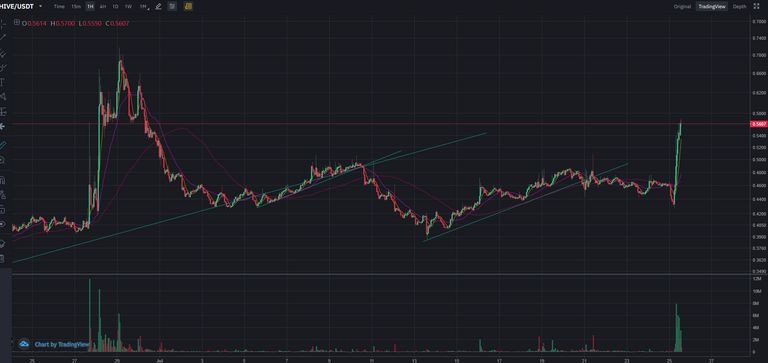
In the last post I posted this chart:
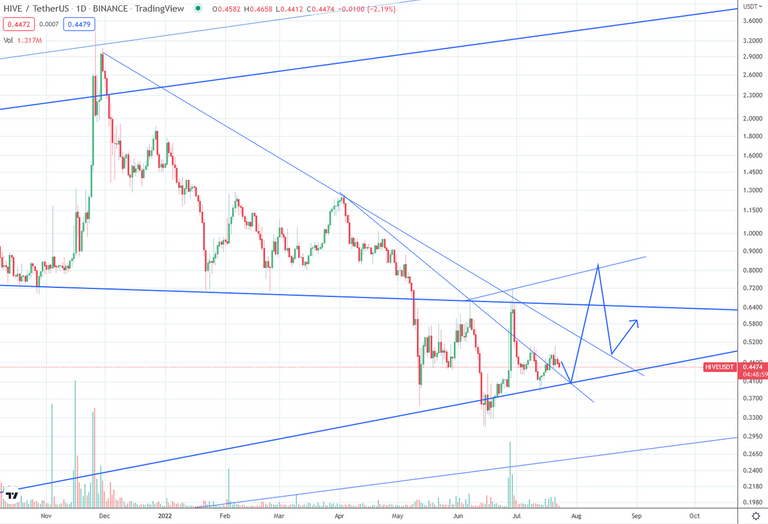
And this is where we are at today:
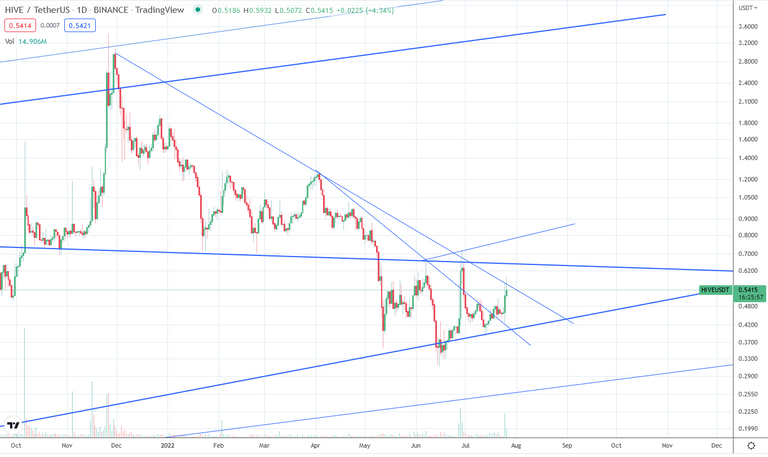
The obvious question is whether we break the trend line coming from the previous highs as well as the ATH. I see two likely possibilities:
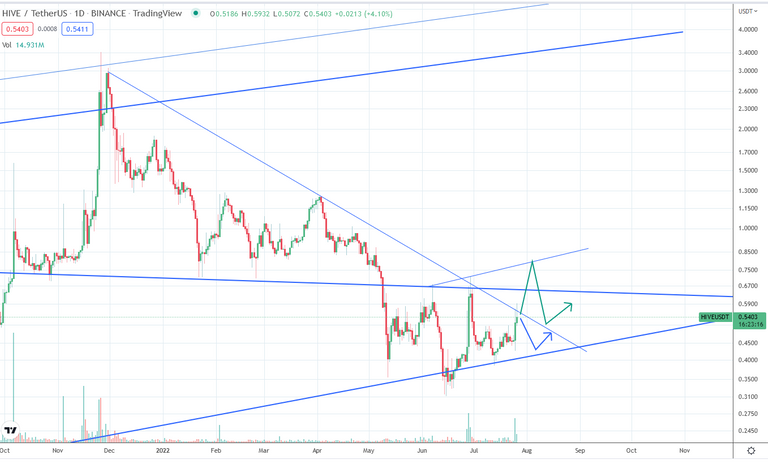
Either the rejection and back to 40 cents, or a push to about 75 cents and back to 50 cents. I am favoring the second scenario, although it is more of a gut feeling. We would definitely need another big push in volume which does not often happen on the 3rd day of a pump, But the good news is that the depth charts shown above, especially the most recent one suggests that there is enough buying pressure for such an action.
As a general reminder: Please keep in mind that none of this is official investment advice! Crypto trading entails a great deal of risk; never spend money that you can't afford to lose!


Check out the Love The Clouds Community if you share the love for clouds!

That's a nice analysis and it looks like you have predicted this pump well... Not sure who has started first, HIVE or HBD, but it's nice to see that even HBD is going back to its peg, and HIVE stayed on the higher levels...
I have picked this post on behalf of the @OurPick project and it will be highlighted in the next post!
yeah would be interesting to know. Seems like the Koreans were pumping HBD - but not sure if it was also them pumping Hive
Hahahaha.
You've been killing it, though, great job!😎👍
thank you :)
Impressive, you nailed it again
Well done! 😃👍
An interesting discovery right here.
From the first chart, it looks like an uptrend but looking at the last chart, it feels like a down trend.
I guess the best thing into keep both hive and hbd/usdt handy
If it gets rejected, we buy more hive.
If it pushes through, we take some profits
if we go to 75 cents can you ask them to not drop it back to 50c. That is so boring and lame, thanks.
unfortunately that is the nature of HIve's fractal :P How it's looking now is that we are probably going back to 40-45 cents before going up again....
I took my eye off Hive, HBD and Cub for a few days and come back and see they have all had spectacular up,ps or spectacular news.
Congratulations on the successful predictions.
Posted Using LeoFinance Beta