Bitcoin's Steep Drop: Analyzing Key Indicators Behind the Decline
(Edited)
Technical Analysis:
Trend and Price Movement:
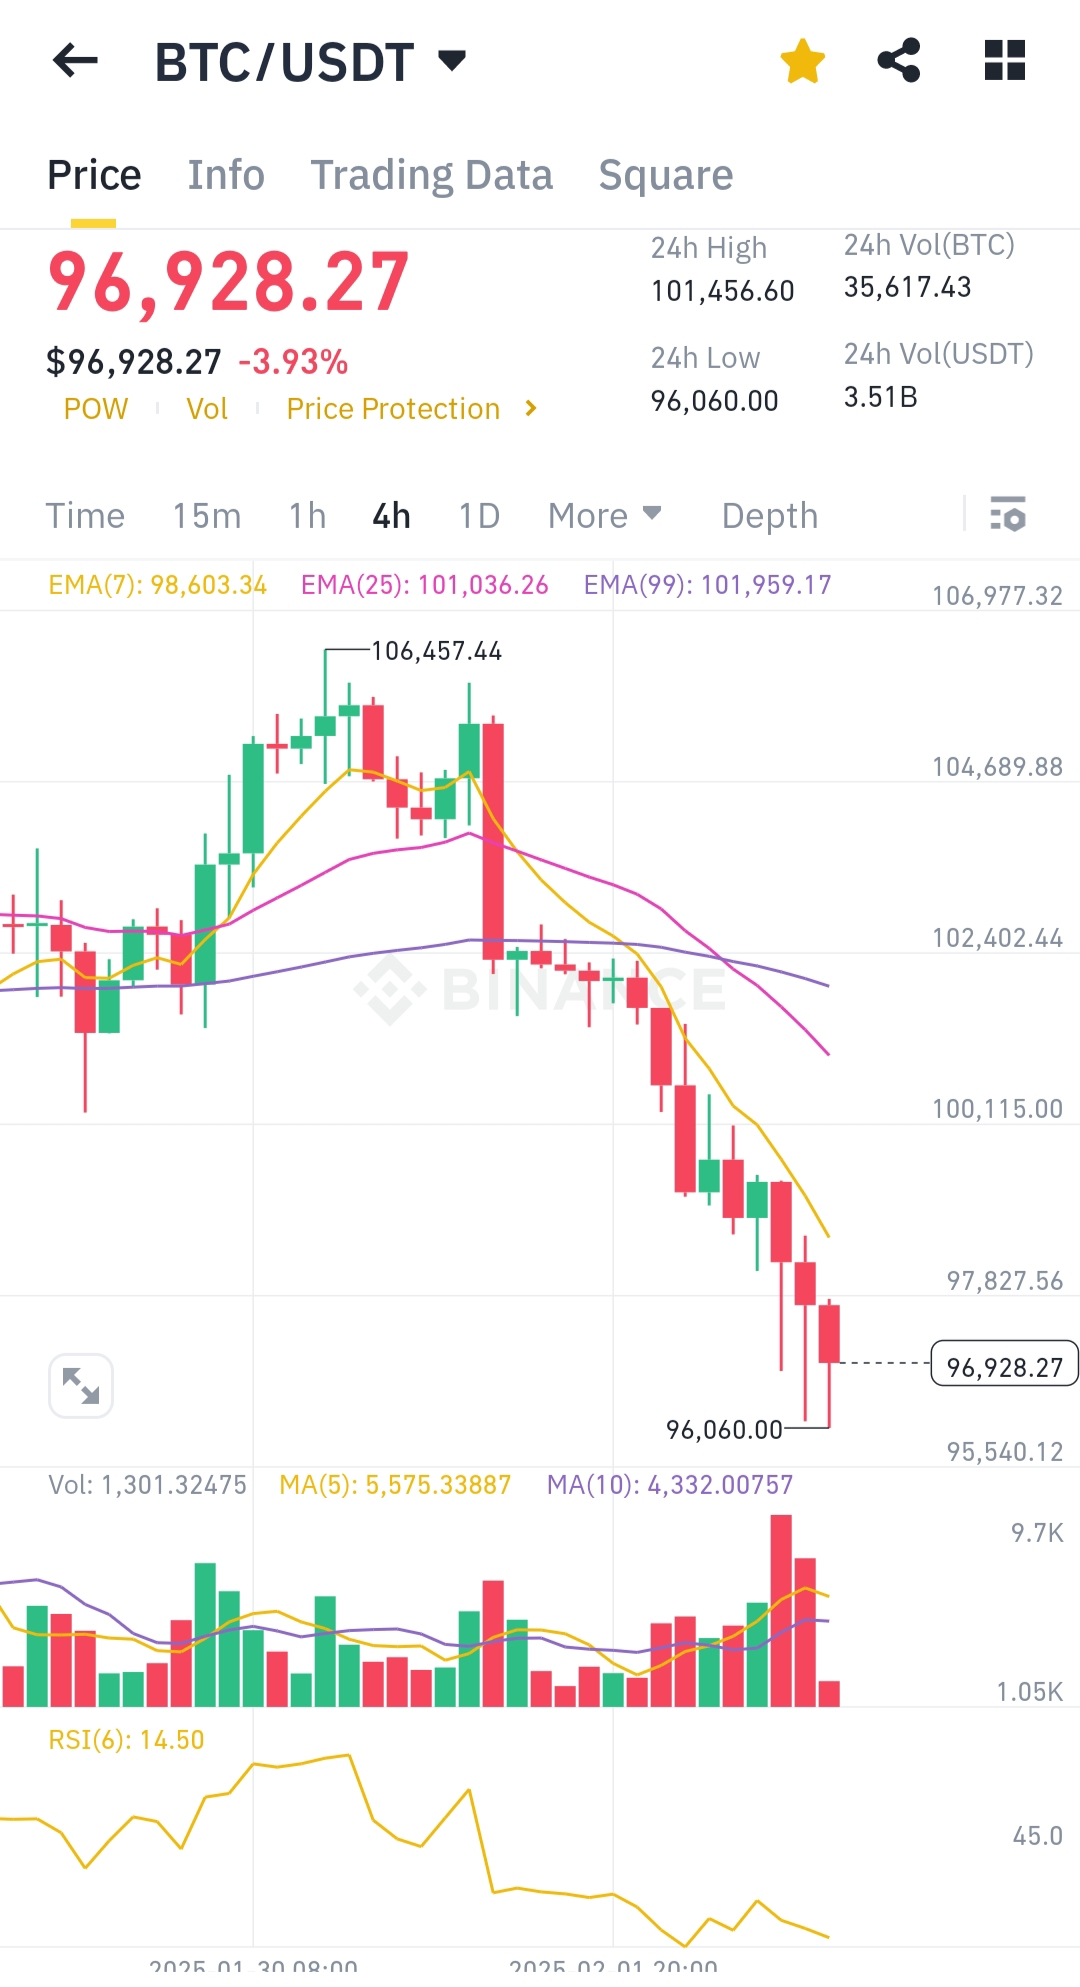
- Bitcoin (BTC) has fallen sharply to $96,928.27, registering a -3.93% decline in 24 hours.
- The price broke below the 7 EMA ($98,603.34), 25 EMA ($101,036.26), and 99 EMA ($101,959.17), signaling a strong bearish trend.
Support and Resistance:
- The 24-hour low is $96,060, indicating potential near-term support.
- The 24-hour high of $101,456 shows strong resistance above.
Volume Analysis:
- High sell volume is evident, particularly in the last few 4-hour candles, reinforcing bearish momentum.
RSI (Relative Strength Index):
- RSI at 14.50 is in the oversold region, suggesting the market is heavily dominated by sellers. A potential rebound may occur if buyers step in.
Key Catalysts for the Decline:
- Breaking below psychological levels ($100,000) triggered panic selling.
- Broader market sentiment or external macroeconomic factors could be driving selling pressure.
- High leverage liquidations may have accelerated the fall.
Conclusion:
Bitcoin's rapid decline is driven by strong bearish momentum, breaking below critical support levels, with oversold RSI signaling possible near-term recovery. Tight risk management is crucial for traders in this volatile environment.
276
0
1.720 NEOXAG
Congratulations @hooiyewlim! You have completed the following achievement on the Hive blockchain And have been rewarded with New badge(s)
You can view your badges on your board and compare yourself to others in the Ranking
If you no longer want to receive notifications, reply to this comment with the word
STOPCheck out our last posts:
You received an upvote of 16% from Precious the Silver Mermaid!
Please remember to contribute great content to the #SilverGoldStackers tag to create another Precious Gem.