Re: Deciphering top quark production at CERN’s Large Hadron Collider
Here is another post in response to the task given by @lemouth on the ongoing citizen science project - a project that has to do with the simulation of particle collision using software instead of the real one ongoing at the Large Hadron Collider.
If my mathematics skill is still anything to go by, this should be the 4th task on the project. The previous 3 tasks are as below:
- Task 1: Citizen science particle physics project on Hive - Let’s get started!
- Task 2: Citizen science on Hive - simulating top quark production at CERN’s Large Hadron Collider.
- Task 3: Citizen science on Hive - detector effects and event reconstruction
The drill is, that anyone with a PC can participate in the project just by installing some software and following stepwise instructions as they are being spelled out by the instructor. The whole thing might look like a bunch of codes, however, one really does not need any coding knowledge to participate. I am a good example as I got zero knowledge of coding. All the documentation about the project can be found by following the hashtag #citizenscience.
The present task has to do with Deciphering top quark production at CERN’s Large Hadron Collider. This has to do with the analysis of those ‘reconstructed-level events’ as spelled out by Lemouth. So let's get started.
Task 1
The software is started using the following codes:
cd madanalysis5
./bin/ma5
And the simulated event is imported using:
import ANALYSIS_0/Output/SAF/_defaultset/lheEvents0_0/myevents.lhe.gz as ttbar
set ttbar.xsection = 505.8 (I was able to access my own cross-section value, luckily)
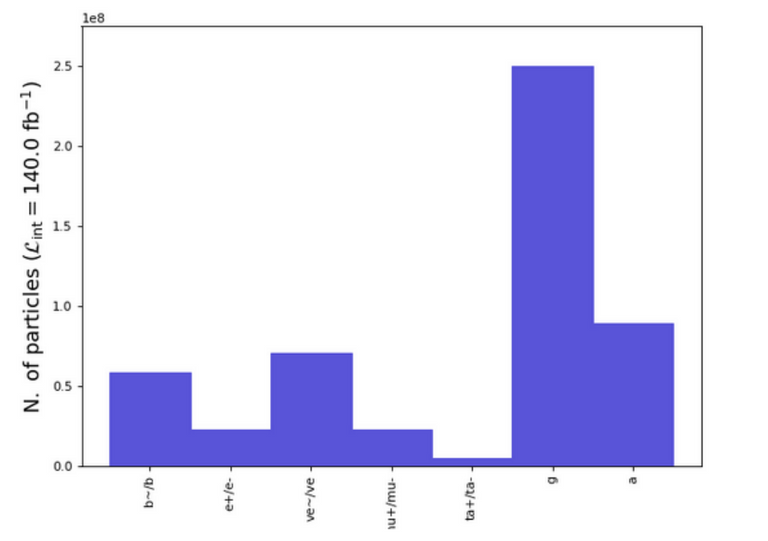
Next is the setting up of Ma5 to normalize the number of collisions recorded during the full run 2 of the LHC and then generating the histogram of the event:
set main.lumi = 140
plot NAPID
submit
open
The result:
Task 2: Lepton and photon multiplicity
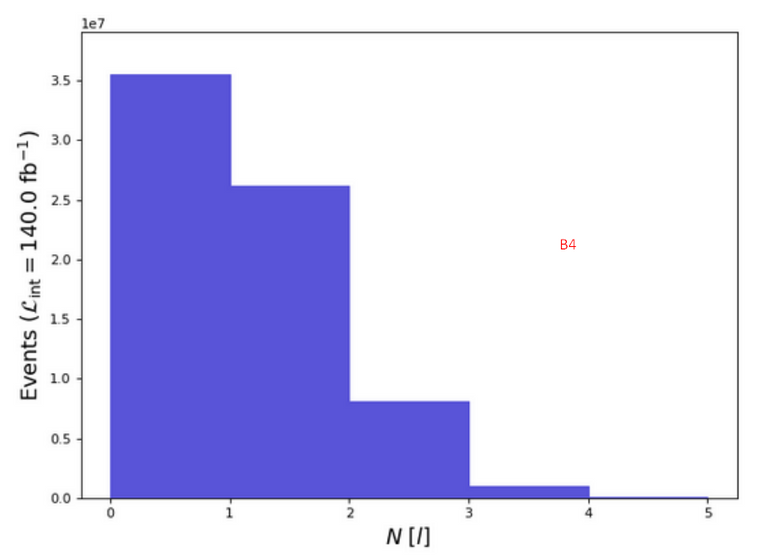
For lepton
define l = l+ l-
plot N(l) 5 0 5
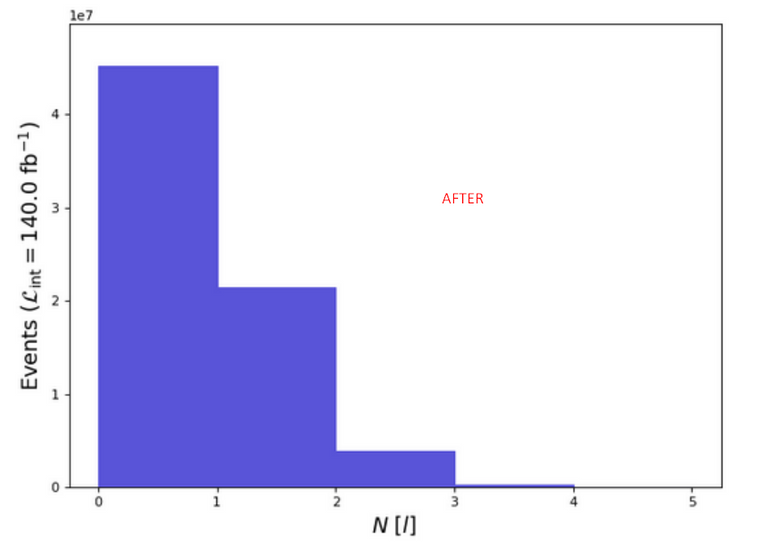
select (l) PT > 20
plot N(l) 5 0 5
plot NAPID
resubmit
open
Result:
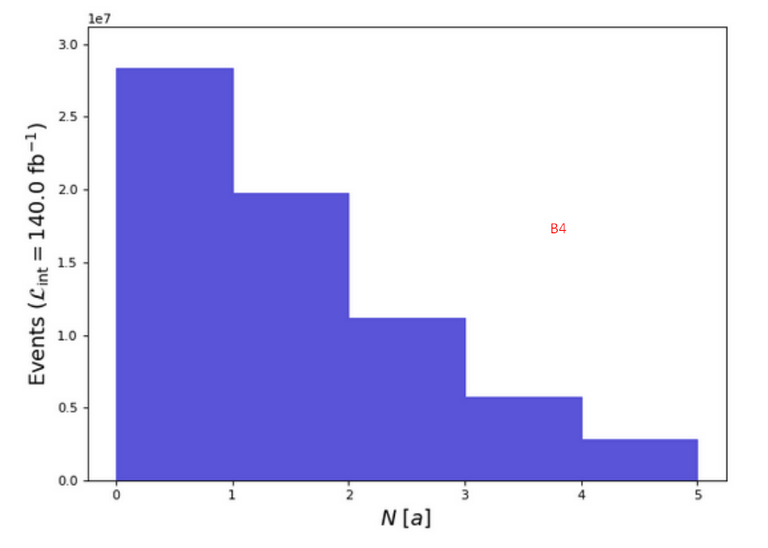
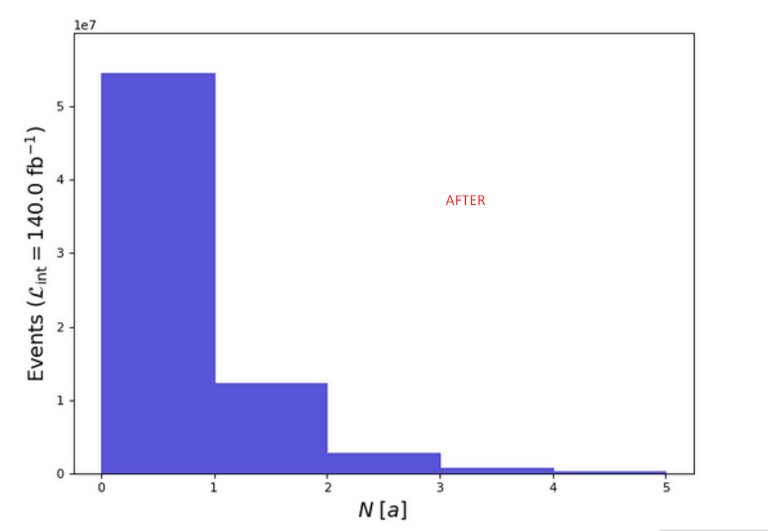
For photon
N(a) 5 0 5
select (a) PT > 20
plot N(a) 5 0 5
resubmit
open
Result:
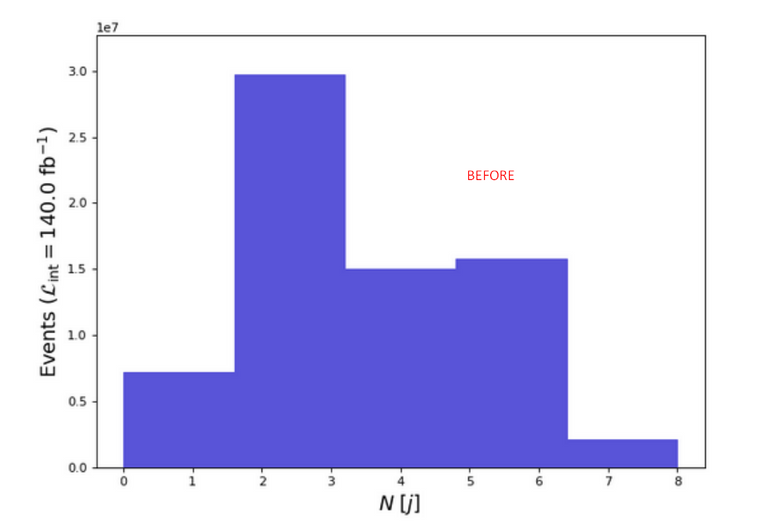
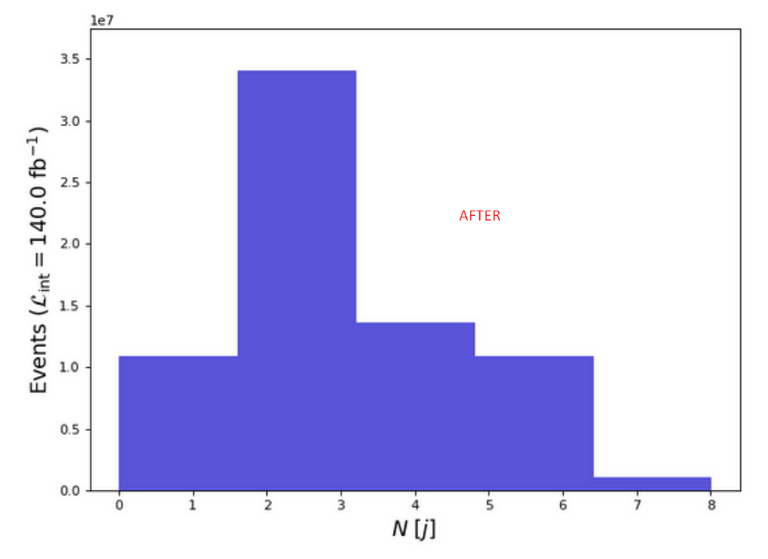
Assignment 1: Jet multiplicity
N(j) 5 0 5
select (j) PT > 25
plot N(j) 5 0 8
resubmit
open
Result:
For b-jets:
N(b) 5 0 5
select (b) PT > 25
plot N(b) 5 0 8
resubmit
open
The result:
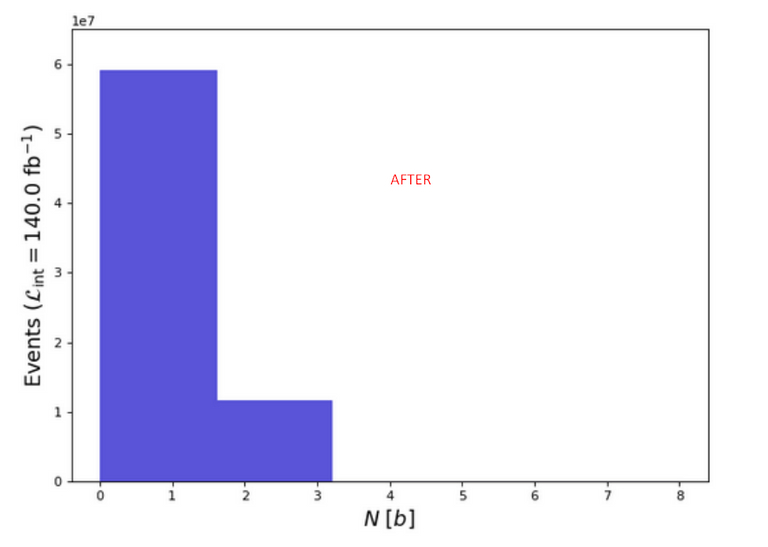
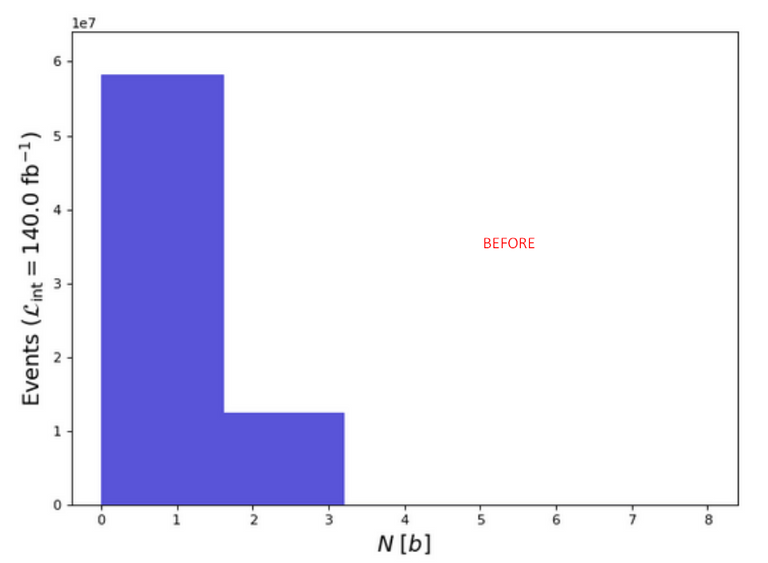
Why very little variation in the before and after cut figures? Perhaps it is because simulated collisions usually produce large amounts of b-jets - two b-jets actually? I hope my guess is correct :)
Task 3: Selecting a subset of simulated collisions
Cut
select N(l)==1
Looking at the effects of the cut on lepton multiplicity
define l = l+ l-
plot N(l) 5 0 5
select (l) PT > 20
plot N(l) 5 0 5
plot NAPID
resubmit
open
The result:
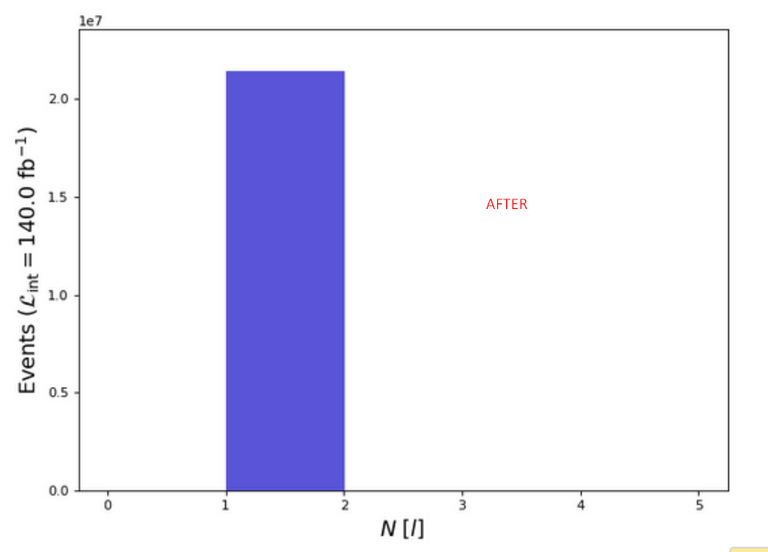
What do I expect as a resulting histogram? Is the output in agreement with m expectation? I really have no idea of what to expect, in all sincerity :)
Task 4: Lepton properties
plot PT(l) 25 0 200 [logY]
plot ABSETA(l) 25 0 2.5 [logY]
resubmit
open
The result:
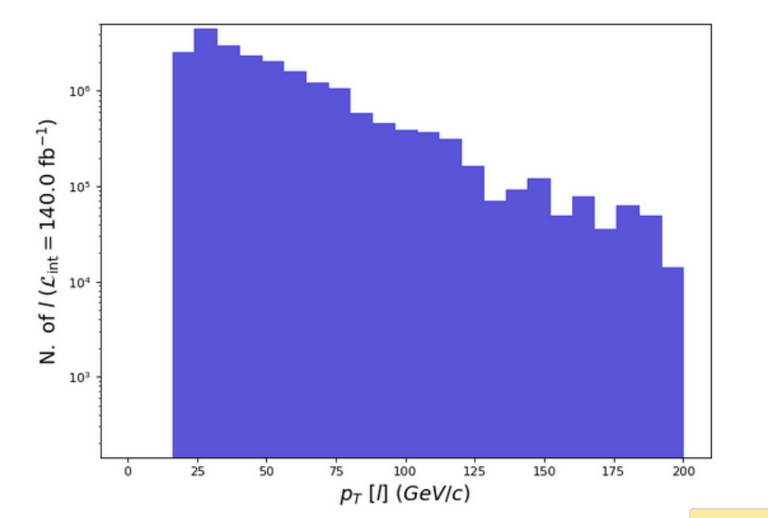
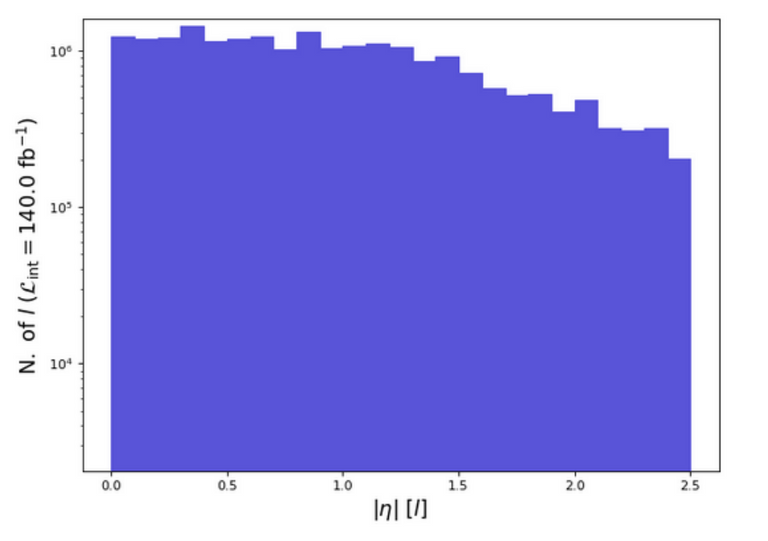
There is a bit of variation in these results and those posted by @lemouth (especially in the screenshot on the left). I hope he can explain the reason.
Next is combining two jets:
plot M(j[1] j[2]) 50 0 250 [logY]
resubmit
open
The result:
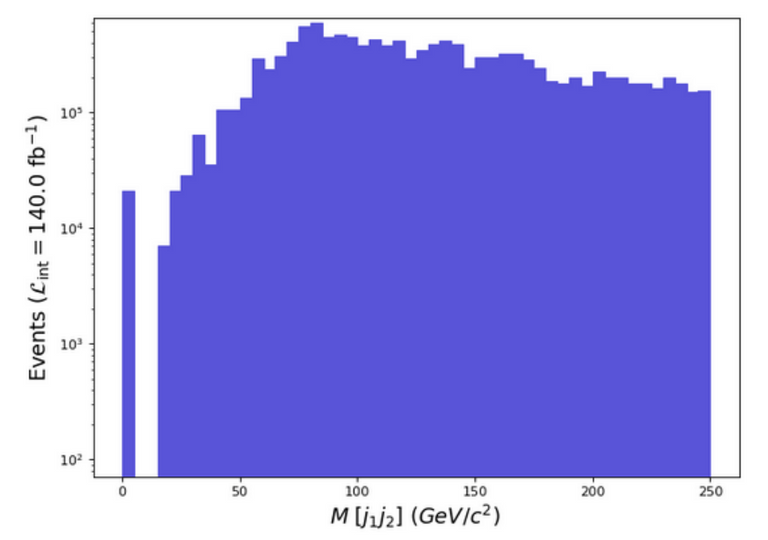
Again, there is a little variation from the result of Lemouth. I await an explanation.
I will leave the last assignment for the pros as I have got no idea how to go about it. I am just glad to follow the project and learn as much as I can while at it.
See you all when the next task drops.
Posted with STEMGeeks
Too mathematically clever for me, but I at least HALF understand it.. 🤪
Half understanding will likely make you top 5% as far particle physics on hive concerned. :)
Did you know my husband's an astrophysicist ? Or at least he studied it before he became a senior physics teacher
@gentleshaid is correct. Understanding half of it makes you one of the top physicists on chain! The next step is to join us in the project ;)
Lol okay I back down and say maybe twenty percent 🤪 ... Or less. I know what the hadron collider does, at least 🤪🤪
Ahaha. I guess I have no way to convince you... Maybe with neutrinos instead of top quarks (as will be done in about 10 days)? ;)
Do you know that joke about neutrinos?
'What do neutrinos and I have in common?'
'Your Mum'
Which is only funny if a guy says it, and is such low level humour that I'm sure you'll forget all about asking me about science.
Damned... I had to look for it on the Internet to understand it (and I didn't find it funny). That's probably a sign of... getting old... Poor me :/
PS: I won't forget ;)
I know, it's not funny at all! It was a joke that my physics teacher husband had to quash out when he was talking about neutrinos with his students. Sigh. I like this one better:
"Nothing, I'm just passing through."
This one was much easier to understand. :)
I believe that I can conclude that your husband works in the field of neutrino astrophysics, doesn't he?
You guys have been having fun without me :)
Ahaha are you jealous? ;)
Tagging @riverflows just for fun...
Thanks a lot for this report and your quick reaction to the tasks of the week. You can find below a few comments and suggestions. And thanks again for spotting the typo in the initial post. I cannot prevent myself from doing it week after week… :D
I confirm that 3+1 = 4 :D
I noticed that you change the maximum value on the x axis to 8. This is a good thing to do. However, you asked for 5 bins between 0 and 8. As the number of jets has to be an integer (by definition), you are into troubles here. If you check carefully the bin widths, you will notice that a single bin cannot be associated with a single integer. You should try either
plot N(j) 8 0 8(8 bins in total) orplot N(j) 5 0 5(5 bins in total) but not an admixture of both.The same remark as above holds. Please double check this further. From there, we will try to answer the additional question from the assignment. For now, I don't give any clue. Maybe at the next iteration ;)
Here, you have selected all events featuring a single lepton. Therefore, after this selection, if you plot the distribution in the number of leptons you should have a single peak centred on 1. This is what you obtained, so that you can conclude that the code does what is has been programmed to do. That’s somewhat a pretty good news, isn’t it ?
This is a bit odd, I agree. Are you sure that you have implemented the lepton multiplicity cut before getting the plot? Do you mind showing me the statistics part given on the webpage generated by the code? This may help me to understand what is going on. For now I must say that I don't know.
Me too. Please share the full webpage generated by the code. You can also type
historyin the shell and share the output with me. Let’s dig into this together.I will post the answer at some point next week. Please be patient ;)
I will try and rerun this and edit this report accordingly.
I will also be on this shortly. I'm certain I implemented the cut.
Please let me know about the outcome. I will also release the solution on Thursday or Friday. Let's try to fix the issue before.
Cheers!
Thanks for your contribution to the STEMsocial community. Feel free to join us on discord to get to know the rest of us!
Please consider delegating to the @stemsocial account (85% of the curation rewards are returned).
You may also include @stemsocial as a beneficiary of the rewards of this post to get a stronger support.
https://twitter.com/BenjaminFuks/status/1526327490351865858
The rewards earned on this comment will go directly to the person sharing the post on Twitter as long as they are registered with @poshtoken. Sign up at https://hiveposh.com.
!1UP
You have received a 1UP from @luizeba!
@stem-curator, @vyb-curator, @pob-curator, @neoxag-curator, @pal-curatorAnd they will bring !PIZZA 🍕
Learn more about our delegation service to earn daily rewards. Join the family on Discord.
Congratulations!
✅ Good job. Your post has been appreciated and has received support from CHESS BROTHERS ♔ 💪
♟ We invite you to use our hashtag #chessbrothers and learn more about us.
♟♟ You can also reach us on our Discord server and promote your posts there.
♟♟♟ Consider joining our curation trail so we work as a team and you get rewards automatically.
♞♟ Check out our @chessbrotherspro account to learn about the curation process carried out daily by our team.
Kindly
The CHESS BROTHERS team
What software are you using to run these simulations?
Posted using Proof of Brain
We use Madanalysis software recommended by @lemouth
Thanks. Looks like a pretty cool tool!
Posted using Proof of Brain
You can check my last four posts carrying the #citizenscience tag to get instructions about how to install those pieces of software and start using them. Our project is always open to new participants ^^