Weekly Bitcoin Price Chart is Getting Ready to Reverse
Bitcoin price is trying to get ready to reverse. I shared lots of price analysis for Bitcoin and said 25500 USD important. Even Bitcoin broke down this support line for a few hours, it went up fastly and It seemed bear trap..
Bitcoin is still in bullish pattern. It is getting closer to reverse.
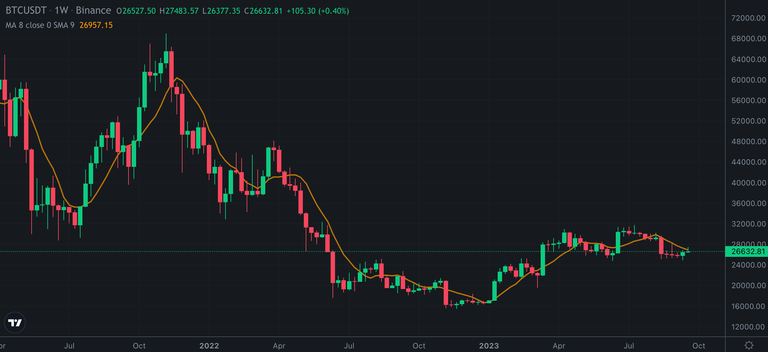
When we look at weekly chart of Bitcoin, it seems to get ready for reversing..
Here you can see weekly chart of Bitcoin and 8-weeks moving average. 8 is one of Fibonacci number that shows us the trend. Bitcoin is close to weekly close above 8-week moving average..

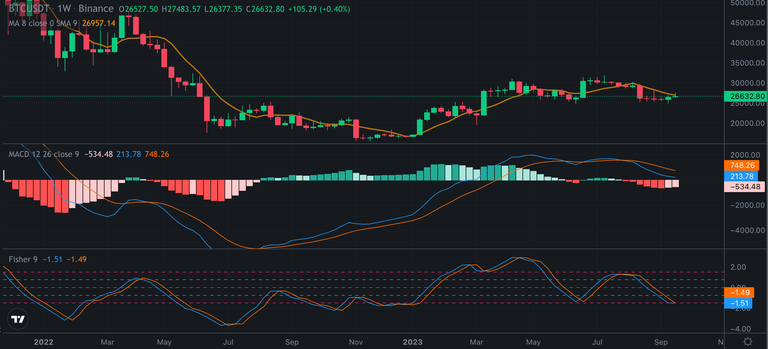
When we look at the Indicators of weekly chart of Bitcoin, MACD and fisher indicators are at good level. They are close to reverse from the bottom. Fisher Indicator is also very important that show us Bitcoin may reverse in a few weeks...

I am bullish for Bitcoin and crypto market. We will see pump in a few weeks.
Waiting..
Posted Using LeoFinance Alpha
https://leofinance.io/threads/chorock/re-chorock-2yj4owzyr
The rewards earned on this comment will go directly to the people ( chorock ) sharing the post on LeoThreads,LikeTu,dBuzz.
Thanks for the updates. Now, we don't know when to expect the real time surge of the crypto market. Seeing btc getting above the initial resistance of 27k. Many would have thought the price will moon further but it was a fake move.
Let's hope that in couple of months we can see the real bullish. Not happy seeing btc getting a reverser.