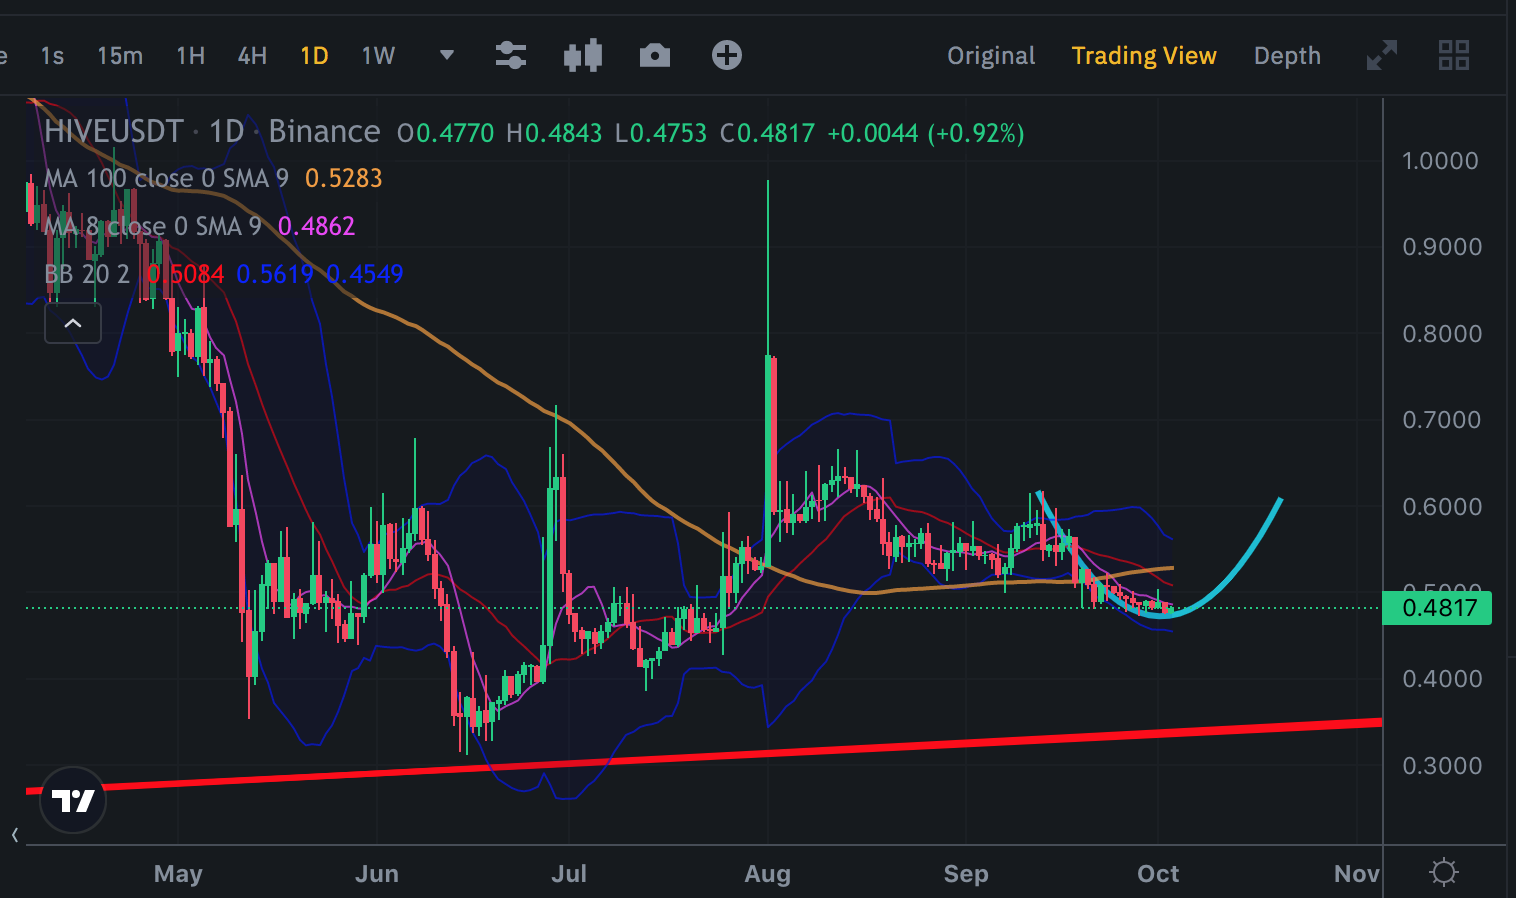
The Bowl Pattern May be Seen on Hive Price Chart
Hive Price is decreasing slowly while losing acceleration. It seems as stable while price stays at 0.48 USD. There may be the bottom of bowl pattern which may be drawn...
There are lots of possible bowl pattern on lots of crypto price charts. Hive is one of them. I look Hive price chart to understand crypto market. Hive is one of my great signal for crypto market...
There is no clear signal on Hive Price chart for longterm. Price may try to touch 0.33 USD where is great support line coming from ever. When Hive price touch this great support line, all of market may touch the bottom. But I think that is early for today. We may see this scenario in next year with recession..

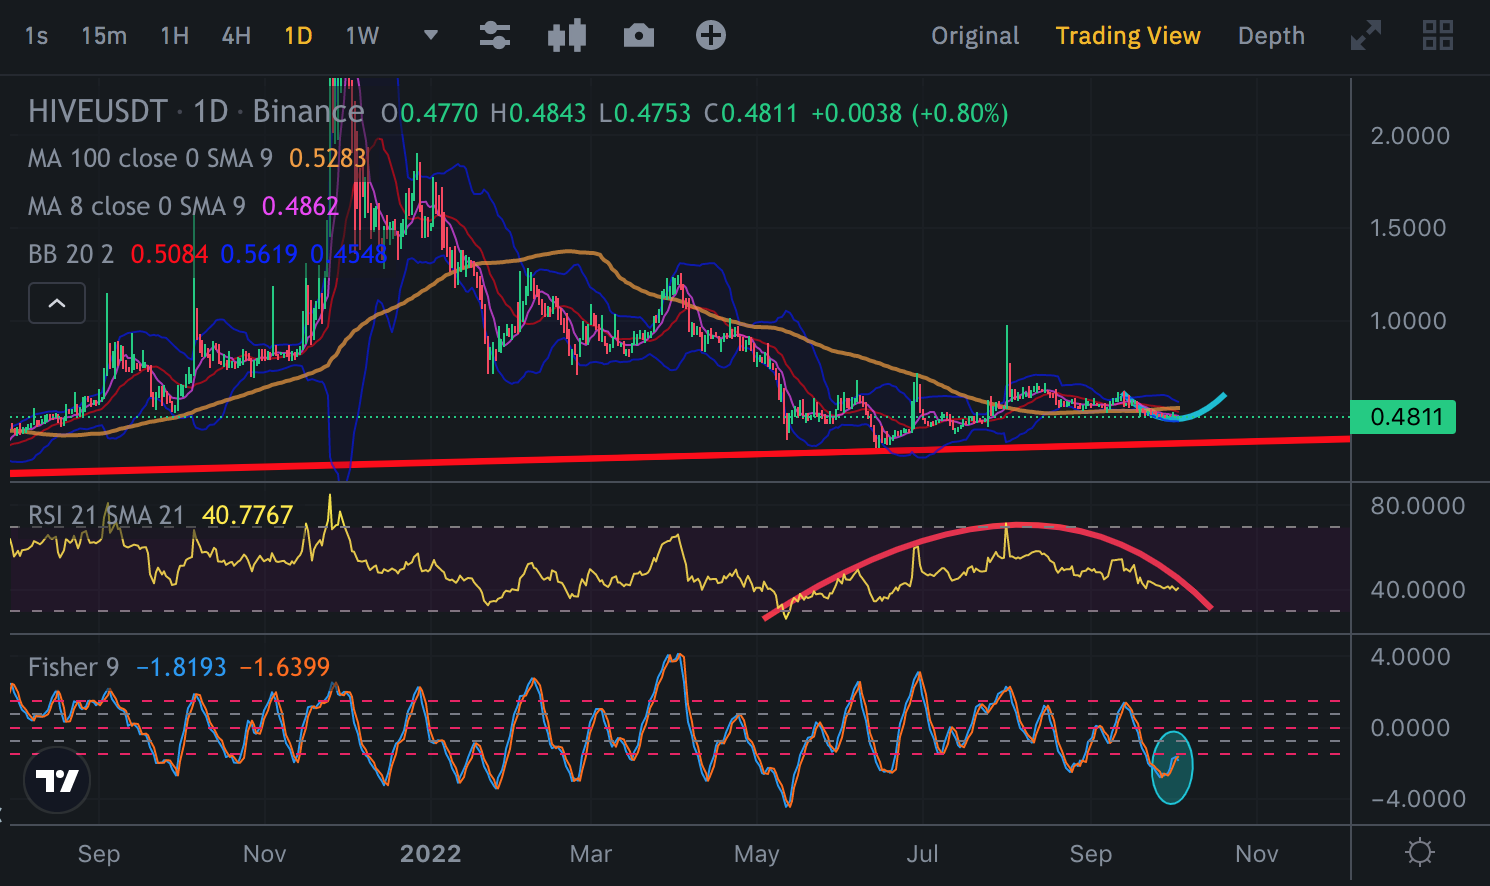
Here we can look Hive price chart for shortterm. Here is daily chart of Hive and Where is reversed bowl pattern on RSI Indicator which is close to end. After break up this reversed bowl pattern, we may see bowl pattern on price chart.
Fisher Indicator is also saying us we may be on the bottom for shortterm..

We will see..
Posted Using LeoFinance Beta
It’s indeed looking pretty nice! I feel a nice run is coming!
Let's rock!
Thank you for your witness vote!
Have a !BEER on me!
To Opt-Out of my witness beer program just comment STOP below
View or trade
BEER.Hey @chorock, here is a little bit of
BEERfrom @isnochys for you. Enjoy it!Did you know that you can use BEER at dCity game to **buy dCity NFT cards** to rule the world.