Small Bullish Signal Seemed on Bitcoin Price Chart
There are lots of bearish signals on Bitcoin price chart. Even Bitcoin price is under price correction for a few months, It may be under this correction for a few months. I shared lots of analysis that Bitcoin price correction may take long time.
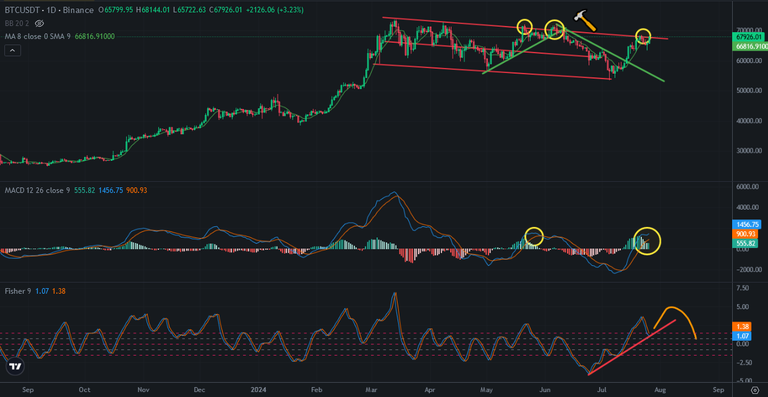
Here you can see daily chart of Bitcoin. Bitcoin price is trying to breaaking up the top line on descending channel. It will be the trigger of bullish trend if it breaks up. But there are lots of bullish traps on Bitcoin price chart. Bitcoin is in still consolidation zone after touching all time high.
Even I shared lots of bearish signals on Bitcoin price chart, small bullish signal seemed on Bitcoin price chart today. I circled the similarities between last bullish traps MACD Indicator level and now. It may reverse from the top. There is uptrend line on Fisher Indicator. It may break down at the middle of August. So, mini bullish trend may continue until the middle of August, If it doesn't go down.
Here you can see weekly chart of Bitcoin price. I circled the similarities on MACD Indicator between 2019 and now. Even MACD Indicator is trying to reverse and go up, It may be a fake move as past. Weekly MACD Indicator can not reverse without touching level. So, It may be only a fake move.
It may be also early go up when we look at the World's condition.
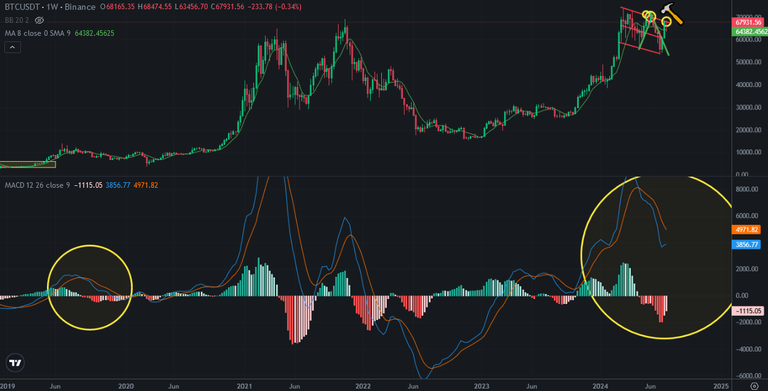
So, It may be a bullish trap again. Even it seemed as a bullish signal on Bitcoin price chart, It may continue until the middle of August.
We will see..
Posted Using InLeo Alpha