Negative Views on the Indicators on Bitcoin Price Chart
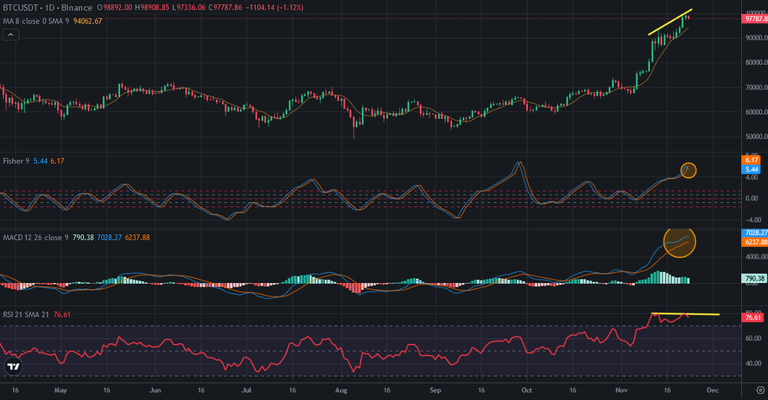
The indicators on daily chart of Bitcoin seem negative. These may be the signals of price correction. I shared a few post and said I was waiting for price correction in this week. We may be close to price correction on Bitcoin price chart.
Here you can see the indicators on daily chart of Bitcoin. Fisher Indicator is on the top and reversed today. When Bitcoin got red daily candle today, Fisher Indicator reversed. MACD Indicator is at the record level. It is on the top and trying to not to reverse. This is why I am waiting for price correction. It should reverse in a few days!
There is also a negative divergence on RSI Indicator. This is one of main reason that I am waiting for price correction.
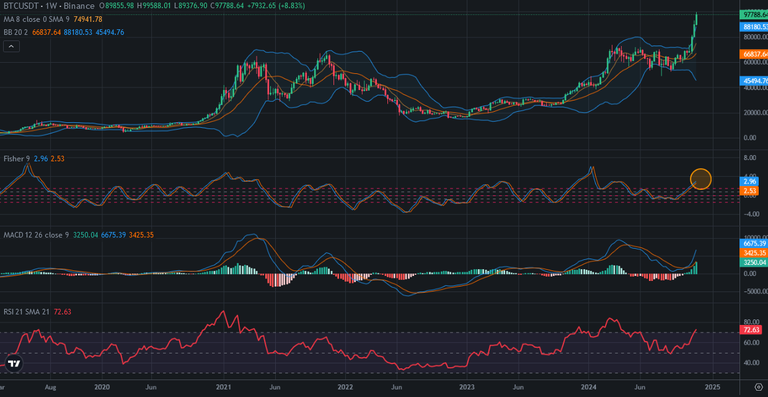
Here you can see weekly chart of Bitcoin. When we look at Fisher Indicator, It is close to the top. It may try to reverse down in a few weeks. This will be a midterm price correction on Bitcoin price chart. Daily price chart shows us short term price correction.
So, we may see two price correction in this year. These will be short term and midterm.
100K will be very hard to break up. 100K will bring mega hype to Bitcoin. So, It may take a few time to break up.
We will see..
Posted Using InLeo Alpha


It has been a good ride