Major Reversing Signals Started to Appear on Weekly Bitcoin Price Chart
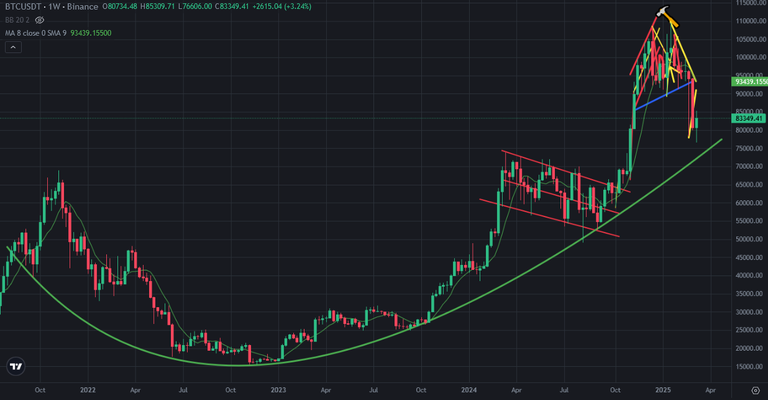
There are a few major reversing signal on weekly Bitcoin price chart. Bitcoin price is under price correction after touching 108K. It went down fast to 7xK USD. We are at 2nd green weekly candles in last 7th week. We have seen lots of red weekly candles in Bitcoin price chart. I think we may be at the end of red weekly candles series.
Here you can see weekly chart of Bitcoin. There is great bowl pattern on this chart. I don't think that Bitcoin will break down this great bowl pattern. We have see lots of red weekly candles at the beginning of 2022. You can see the bottom after these weekly red candles. So, Bitcoin price may be close to the bottom.
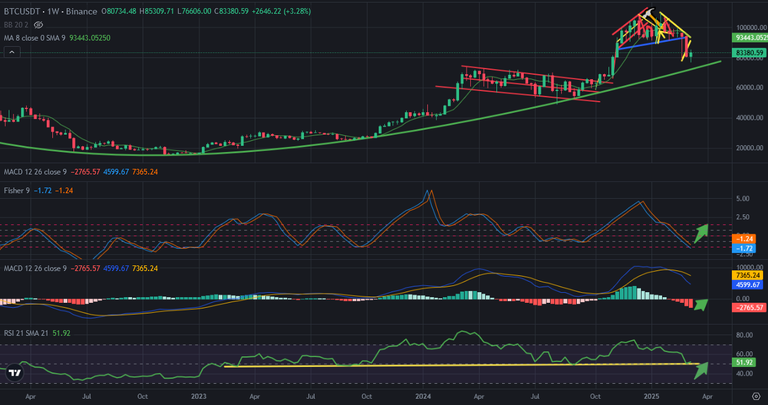
Here you can see the indicators on weekly chart of Bitcoin. Fisher Indicator is on the bottom and ready to reverse up.
MACD Indicators is going down for 5 weeks. It may be completed correction. There is great support line on RSI Indicator. It is supported again in last week. So, All of major indicators seems bullish. We may reverse up in a few weeks.
Even Bitcoin price will not go up, It will not go down. We may enter consolidation time as I said in 2022. Market maker may want to give fear to investors. As I said Bitcoin price may not break down great bowl pattern..
We will see..
Posted Using INLEO
Congratulations @chorock! You have completed the following achievement on the Hive blockchain And have been rewarded with New badge(s)
You can view your badges on your board and compare yourself to others in the Ranking
If you no longer want to receive notifications, reply to this comment with the word
STOP