Green Candle After 9 Red Weekly Successive Candles in Bitcoin Chart
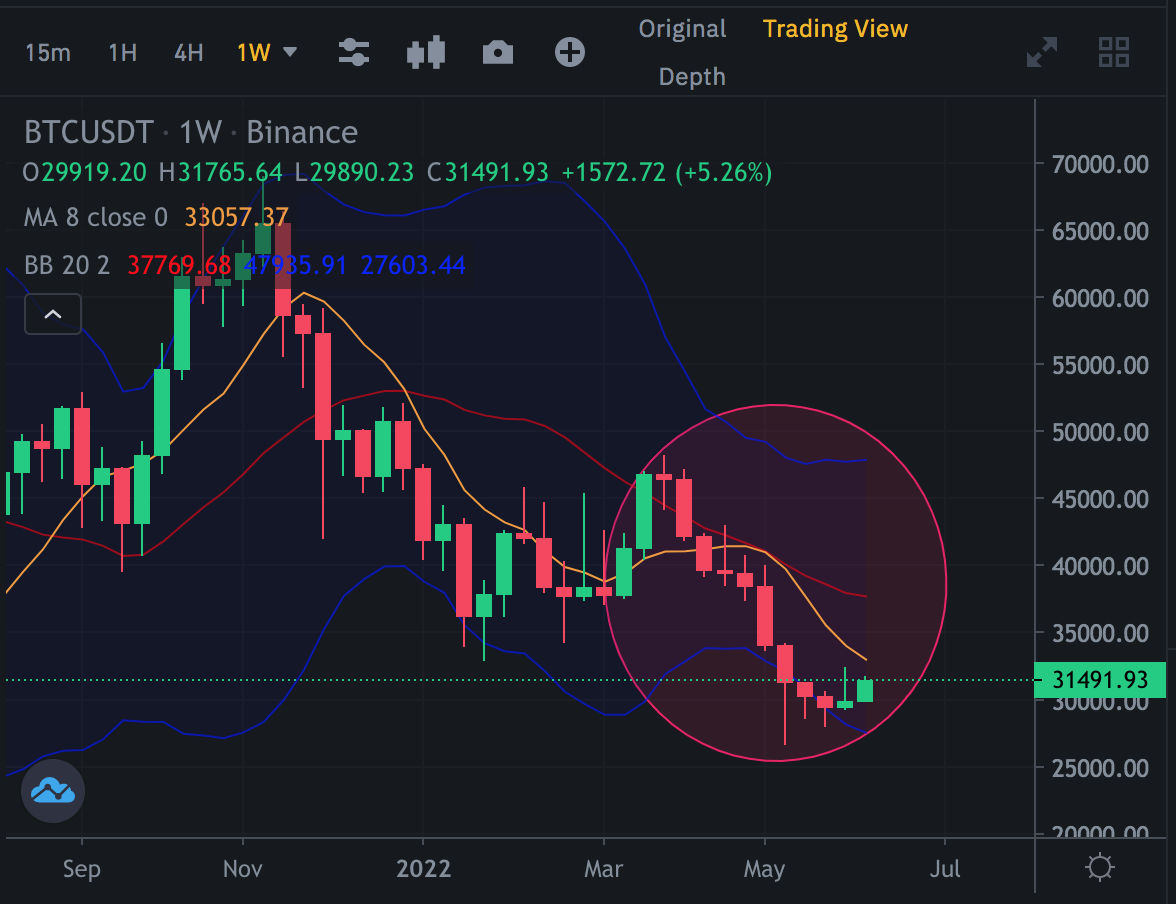
Yesterday was the close day of week. Finally Bitcoin closed this week with green weekly candle after 9 red weekly successive candles...
It was the first time to see 9 red weekly candle in Bitcoin price chart. But there is a small green candle after 9 red candles. It might be bigger...

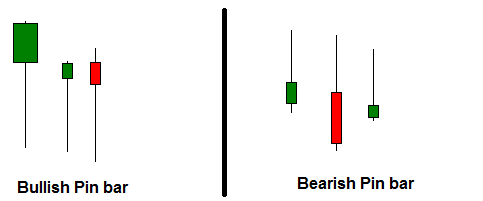
There are lots of fake moves in Bitcoin price chart. We saw a few bullish pin bars in last weeks, Bitcoin closed last week wieh bearish pin bar...

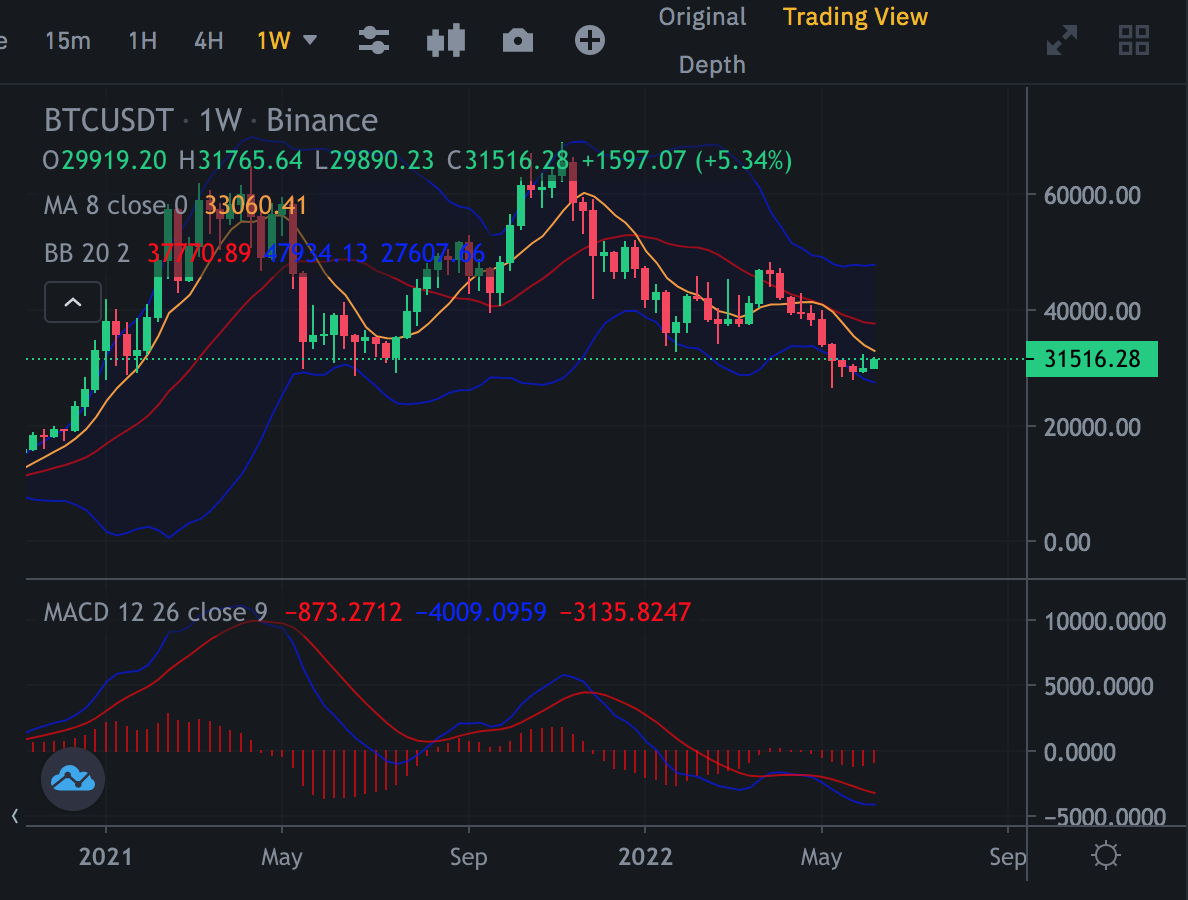
Weekly MACD indicatoris reversing. Selling pressure is decreasing in Bitcoin price chart..

33,333 is great point for Bitcpin price. If we see Bitcoin price above, wellcome to bullish season.
We will see..
Posted Using LeoFinance Beta
0
0
0.000
Congratulations @chorock! You have completed the following achievement on the Hive blockchain and have been rewarded with new badge(s):
Your next target is to reach 54000 upvotes.
You can view your badges on your board and compare yourself to others in the Ranking
If you no longer want to receive notifications, reply to this comment with the word
STOPTo support your work, I also upvoted your post!
Check out the last post from @hivebuzz: