Bullish & Bearish Patterns on Bitcoin Price Chart
There are bullish and bearish patterns on Bitcoin Price chart. Bitcoin price tested above 22K and back to 21K today. It is important level for Bitcoin. There are both bullish and bearish patterns on Bitcoin Price chart that lots of investor think that Bearish pattern will work..
Bullish
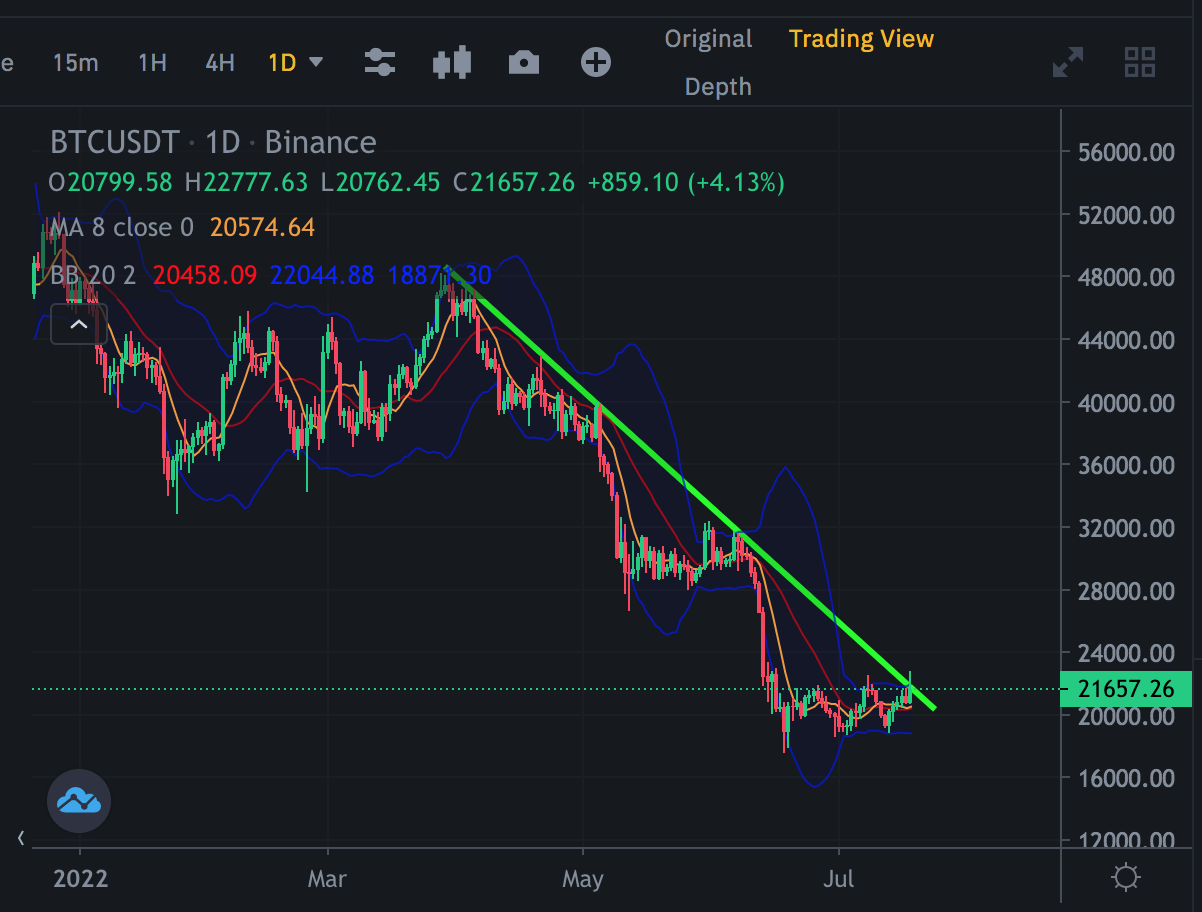
Here is bullish pattern on Bitcoin Price chart. Bitcoin price broke up down trend line coming from 48K. It is tested 5 times before. Daily close will under this resistance and Bitcoin price should close a day above resistance. We may see huge bullish moves after this..

Bearish
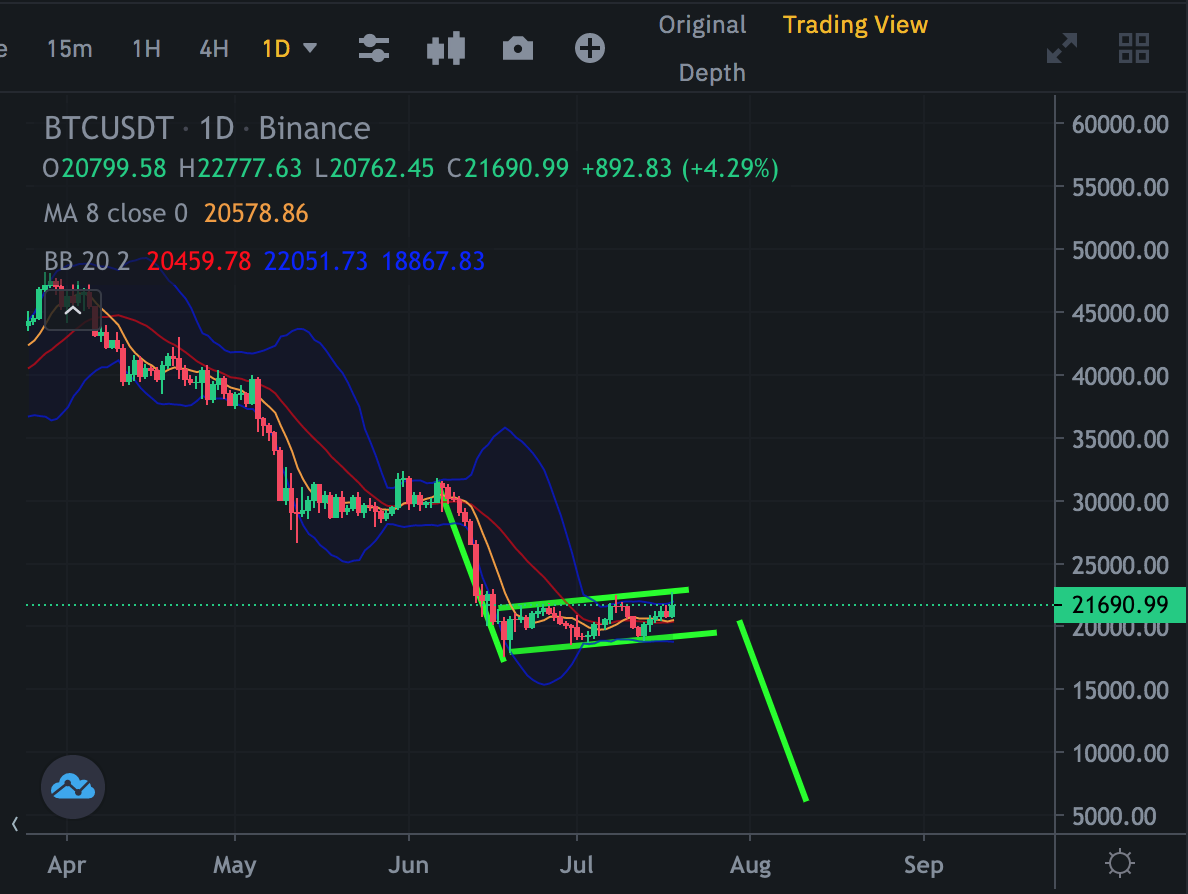
Lots of investors draw this bearish flag pattern on Bitcoin price chart. If this happens, lots of people who dream to buy Bitcoin on 10K or below, will be happy.

22K is important for Bitcoin price. If we see daily close, bearish pattern and resistance will be rekt..
What do you think?
Is it bearish or bullish?
Posted Using LeoFinance Beta
