Bitcoin Price Will Test to Break Up the Top Line of Descending Channel
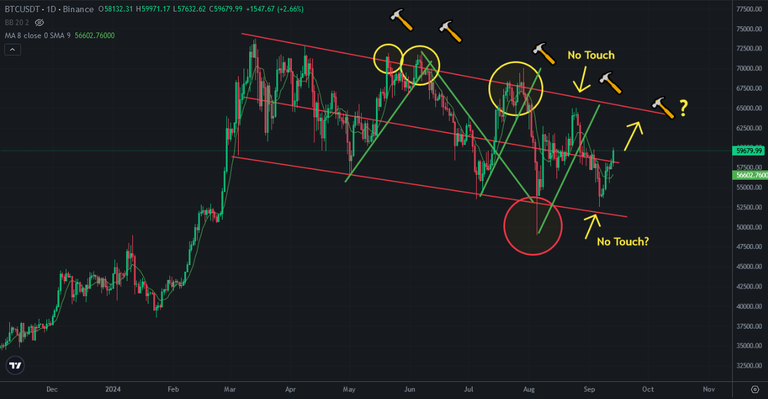
Bitcoin price stucked into descending channel since March. We have seen 4 bullish traps during this time. We have seen a bearish trap at August. After bullish and bearish traps Bitcoin price reversed without touch up and down lines of descending channel.
Here you can see daily chart of Bitcoin and my draft. I shared a post about Bitcoin price and said I was hard to break up the middle line of descending channel but
bitcoin broke up the middle line of this channel.
It is time to follow Bitcoin price If it break up line of descending channel or not.
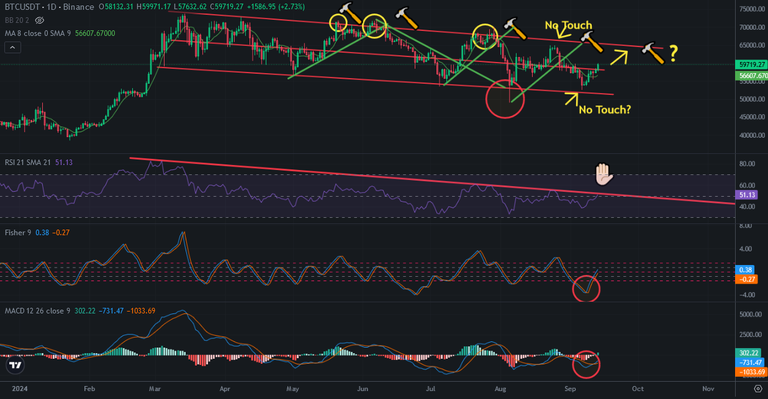
First of all we should follow RSI Indicator on daily chart of Bitcoin. There is great downtrend line on RSI Indicator. If Bitcoin price goes up to 62K, RSI Indicators downtrend line may be broken up. If it breaks up Bitcoin price will start new pattern. Bitcoin price may reach all time high.
But it is very hard to break up. 62K is not the top level of descending channel. But RSI Indicator is more important than price. If downtrend of RSI Indicator breaks up, I am sure that we will not see bullish trap on Bitcoin price. We will see all time high!
We are entering important days for fundamental analysis. FED meeting is coming soon. Bitcoin price may wait this date.
We will see..
Posted Using InLeo Alpha
Its a paper hands trap
I'm holding for now. Maybe buying small amounts on dips.