Bitcoin Price Broke Up Descending Channel Touched Downtrend Line
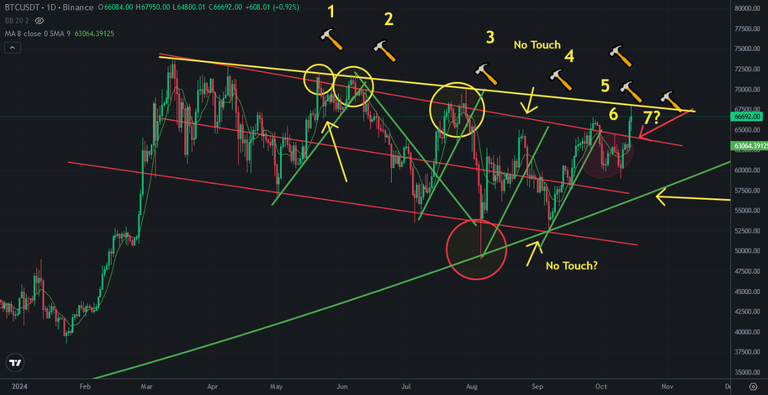
Yesterday Bitcoin price broke up the top line of descending channel. It may be a bullish trap again. I shared a post about this breaking up and It may not be a bullish trap, It may be the beginning of mega bullish season. Today Bitcoin price touche downtrend line.
Here you can see daily chart of Bitcoin price. There is downtrend line I drew it as yellow. After touching downtrend line Bitcoin oprice went down. Bitcoin may break up this downtrend line. If it happens, We can be more sure that we entered mega bullish season!
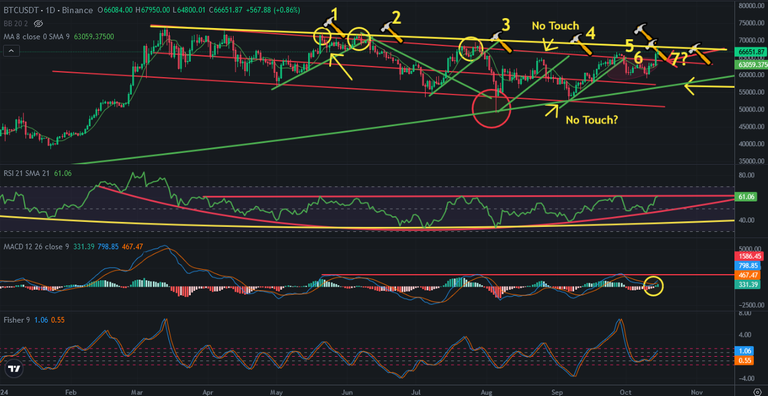
Here you can see the indicators on daily chart of Bitcoin. RSI Indicator is so close to great resistance. It may touch today or tomorrow. We will see what will happen if it touchs.
MACD Indicator also reversed and going up. It needs a few days to meet with great resistance. We should see the breaking ups of these resistances!
Fisher Indicator is also good level for bullrun.
MACD and RSI Indicators have great resistances! We should see breaking up in these indicators!
I will wait and see if it breaks up or down. I want to be sure!
It is not too late if bullish season starts. I need a few days.
We will see..
Posted Using InLeo Alpha


I am all over anything close to 60K or less.