Bearish Trap May be Close on Bitcoin Price Chart
There were lots of bullish traps on Bitcoin price chart in this year. When Bitcoin price were going up lots of investors were waiting for new all time high. I was ready for bullish traps and I shared lots of analysis about these traps to warn you.
I am changing my side to bullish slowly. Price correction on Bitcoin price chart may be at the end. So, We may see bearish traps on Bitcoin price chart.
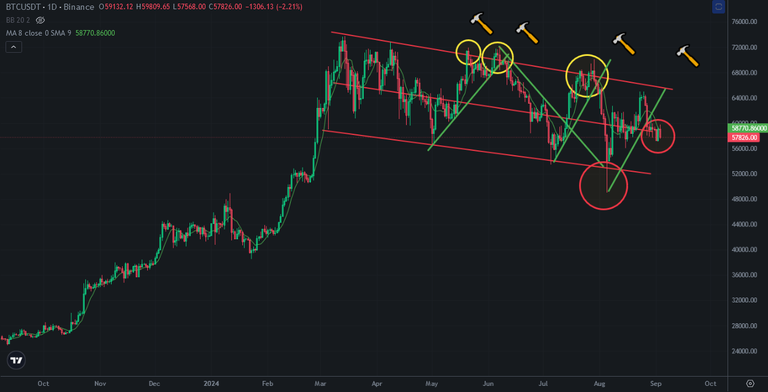
Here you can see daily chart of Bitcoin. This is my draft I shared it a few months ago. Bitcoin price stucked into my draft. Bitcoin price was on the middle line of descending channel yesterday and It broke down today. You can see what happened after breaking down the middle line of descending channel.
But this breaking down may be a bearish trap!
Here you can see the indicators on daily chart of Bitcoin. There is mega downtrend line on RSI Indicator. Bitcoin tested to break up this line lots of times. Even it is under this downtrend line, MACD Indicator touched the support line. This is one of bullish signal..
Fisher Indicator is also at the bottom. So, we may see price reversing on Bitcoin.We may see another test to break up downtrend line on RSI Indicator.
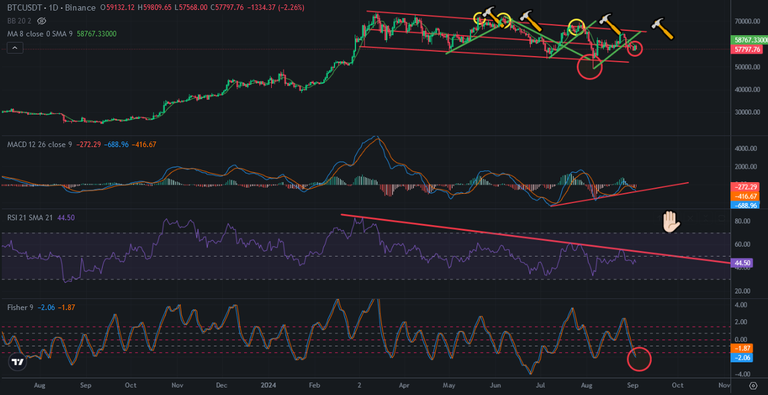
When we look at some of altcoins we can see the bottom. So, I don't think that Bitcoin will go down the bottom line of descending channel.
It may be bearish trap.
We will see..
Posted Using InLeo Alpha
Thank you very much! I updated my chart, I see what you mean there!