4 Red Weekly Successive Candles in Bitcoin Price Chart After 2 Years
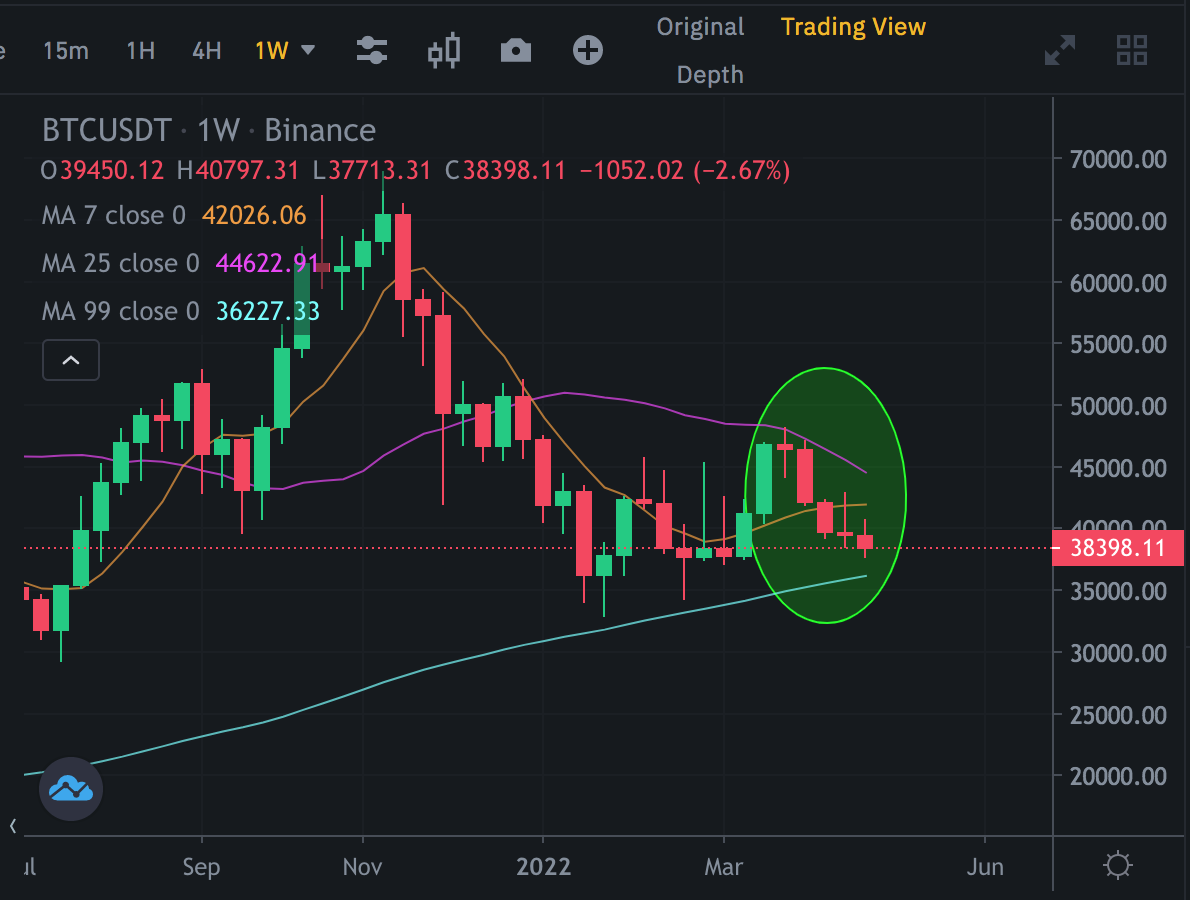
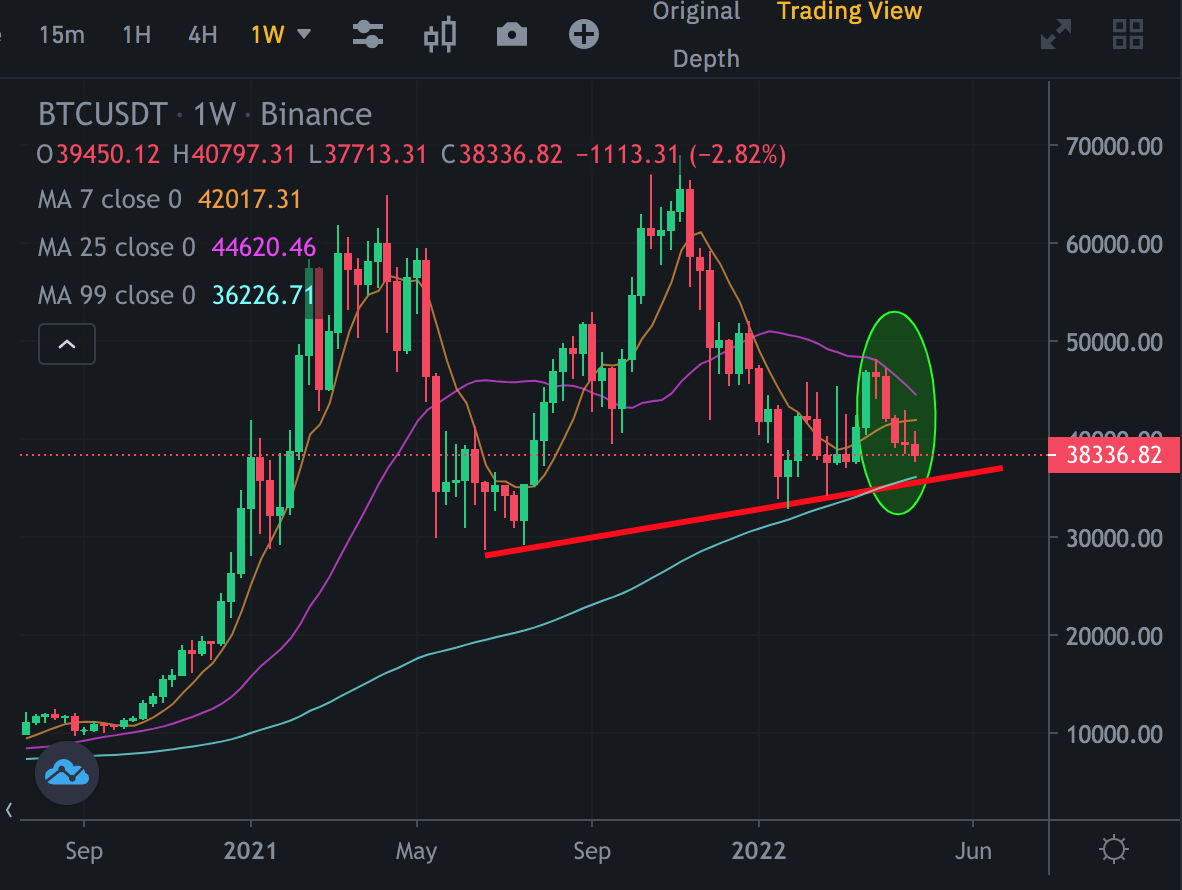
Bitcoin has red weekly candle in last week and There are 4 red weekly successive candles in Bitcoin price chart after 2 years..
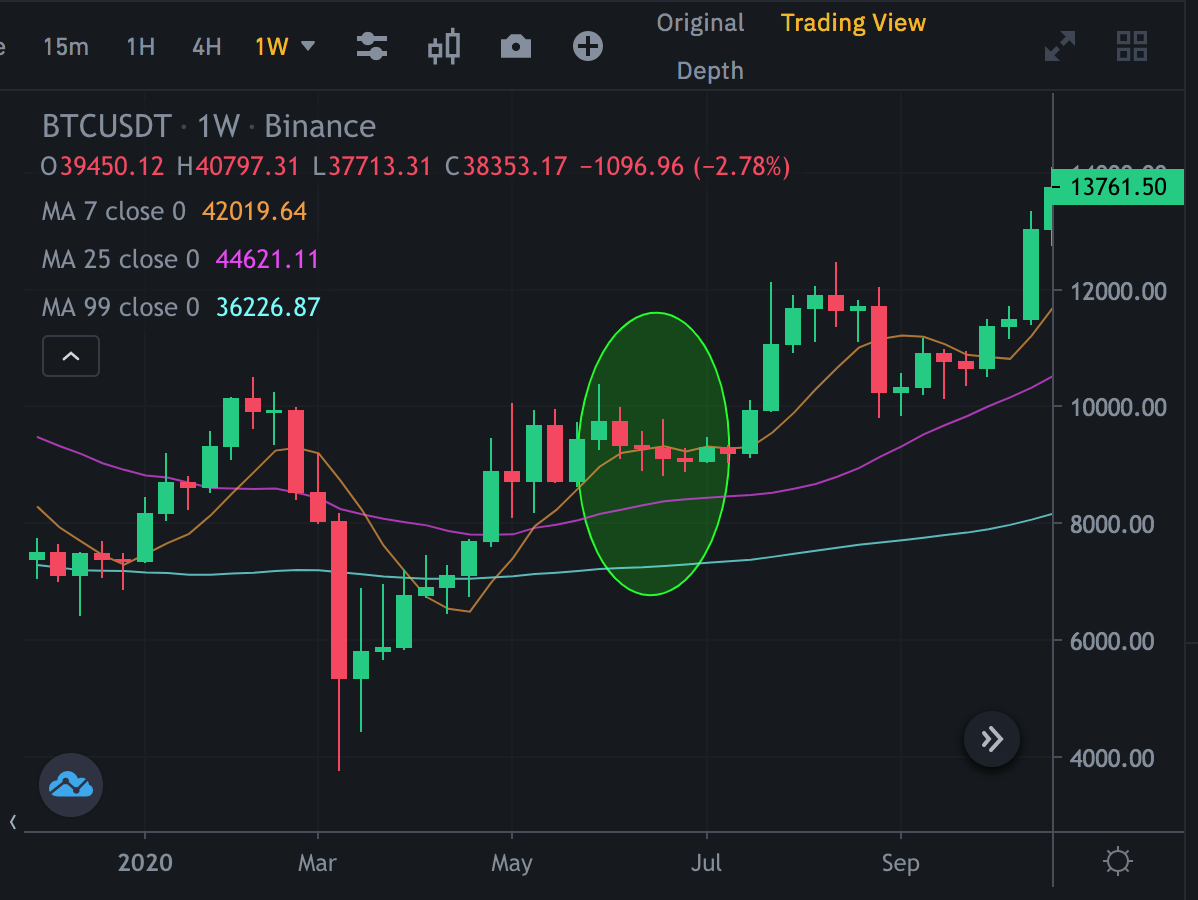
I shared a post Keep Calm - There is no 4 Weekly Successive Red Candles in Bitcoin Price Chart. Unfortunatelly I happened...

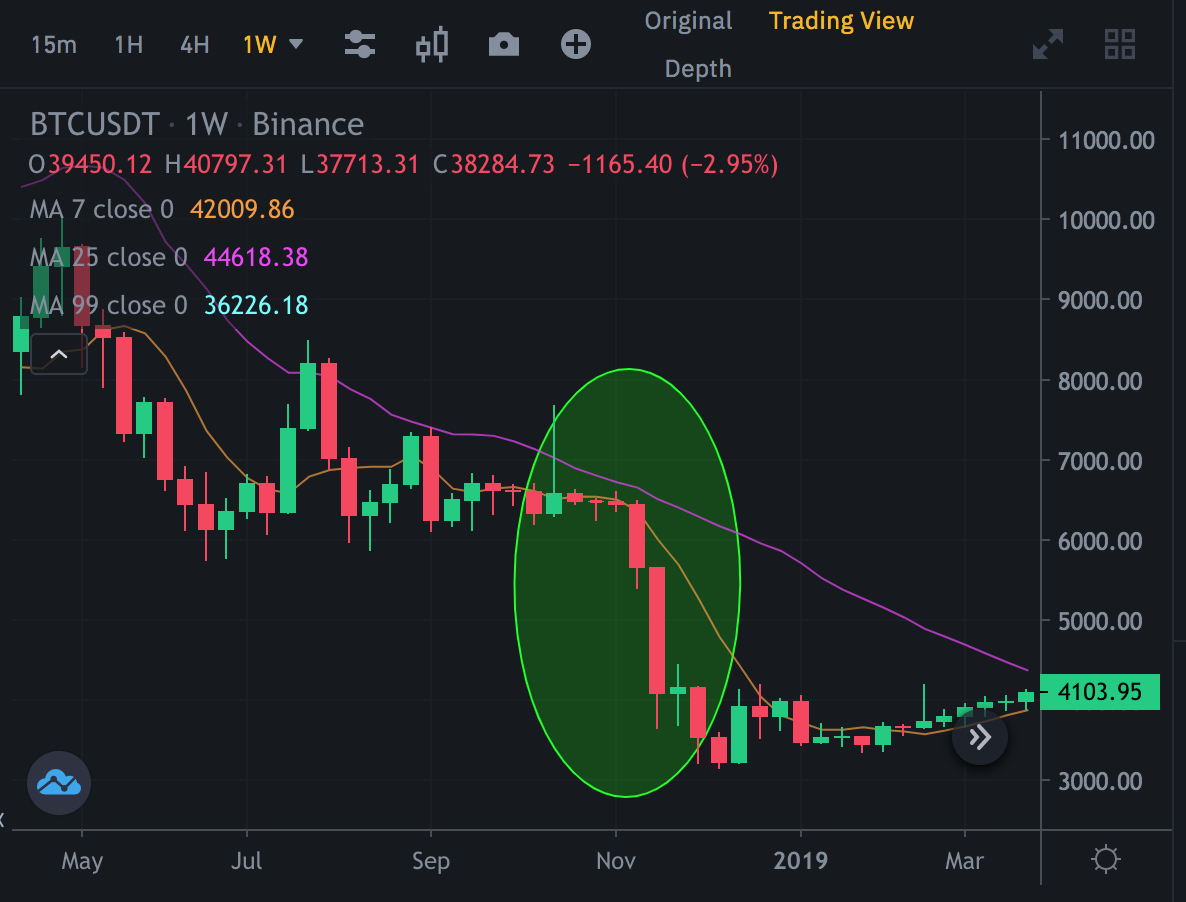
We had seen 4 Red Weekly Successive Candles 2 years before...

This week began bloody for cypromarket. Elon Musk bought Twitter and helped Bitcoin price to rise, but I helped only for a day...
Bitcoin Price is going down again...
Now, We can see 5 red weekly successive candles in Bitcoin price chart. We had seen this 5 red weekly chart in end of 2018... There was huge down move...

If we see red weekly candle after this week, There may be a huge down move in Bitcoin price chart... It is so similar to 2018...

Hope to not to see this scenario again...
Posted Using LeoFinance Beta
View or trade
BEER.Hey @chorock, here is a little bit of
BEERfrom @pixresteemer for you. Enjoy it!Learn how to earn FREE BEER each day by staking your
BEER.Yea, today i saw Bitcoin reach $40, currently trading around $38, the way it is reducing is just do alarming