Hive Monthly Statistics – 2024.08

Many people have contacted me asking me to start publishing statistics about the Hive blockchain again. So To meet these requests, I have decided to reactivate this service and make it a monthly publication instead of a daily one.
Welcome to the analytical report about the Hive blockchain.
All the information presented in this report is based on the data collected from the blockchain until 2024-08-31 midnight UTC. This report aims to provide you with a clear view of what is happening on the Hive blockchain.
1. New users
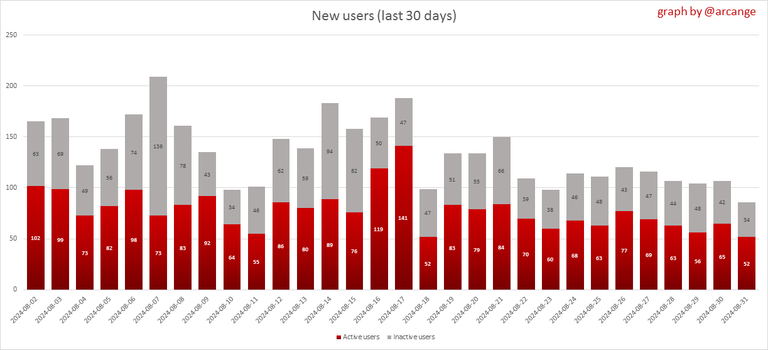
This chart shows the number of newly registered users on the blockchain and how many of them became active. The chart is kind of dynamic! A user can register one day and become active a few days later. Therefore, the number of active users on a specific date may change from day to day.
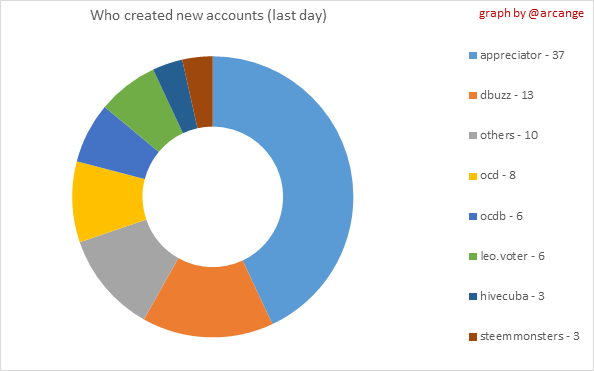 | 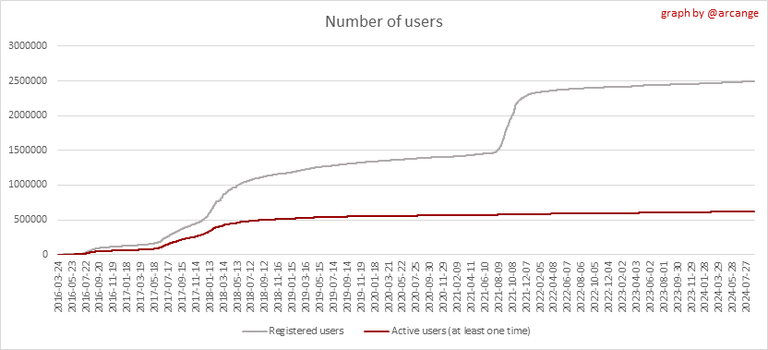 |
These two graphs show who created new accounts during the last day and the total number of registered accounts. The red line shows how many of them have been active at least once (active meaning publishing a post, commenting or voting). They are included even if they become inactive later.
2. Active users
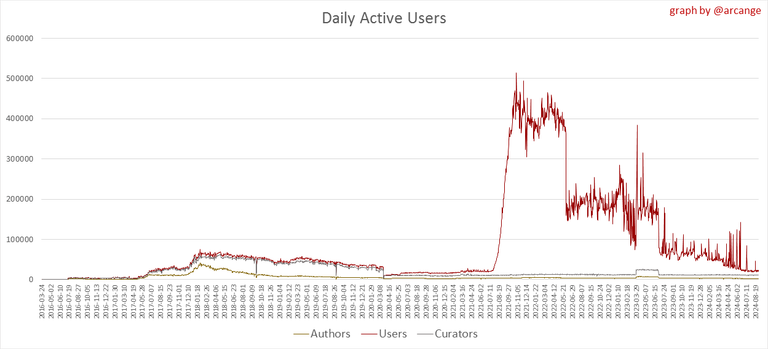 | 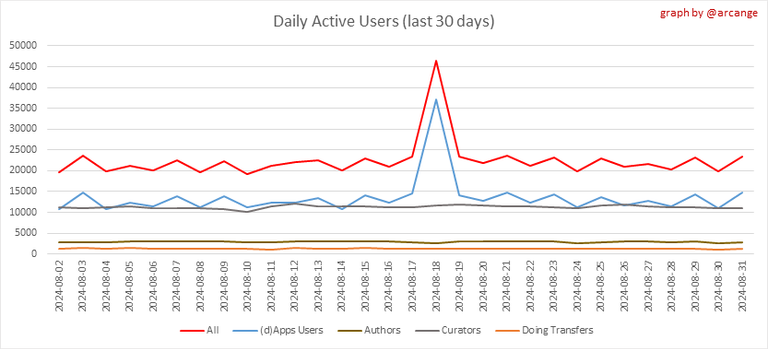 |
These graphs show the activity of users over time and in more detail the last 30 days. In these graphs, "active users" are those performing any type of transaction on the blockchain.
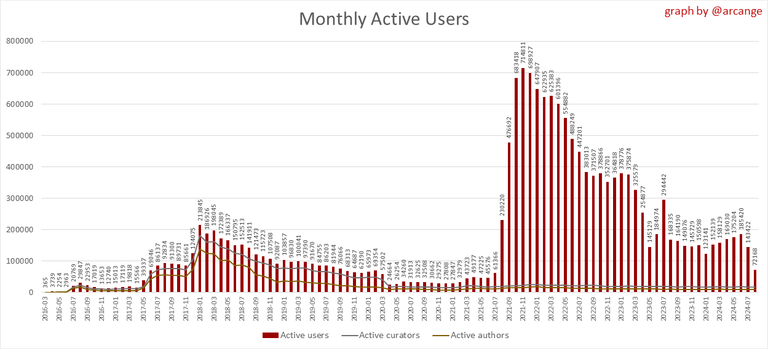
The last graph is a monthly summary of the active users. Be careful when interpreting the value of the last column which can be much lower if the end of the month has not yet been reached.
3. Apps
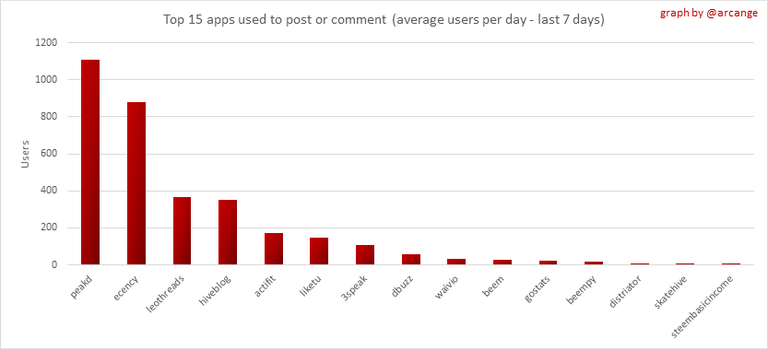
This graph shows which applications are most used to publish posts and comments. Please note that the same user can use several different applications.
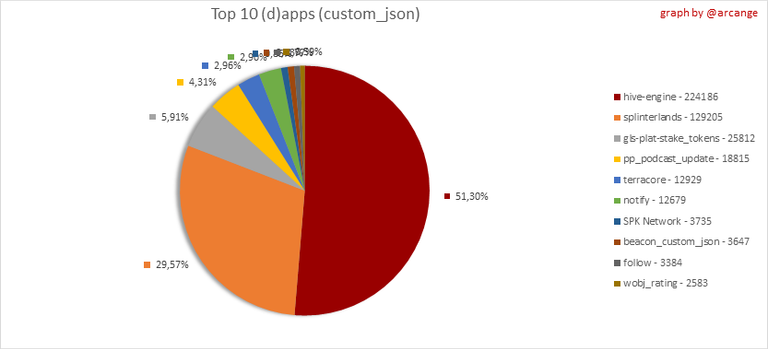
This graph shows which applications generate the most activity (custom_json operations) on the blockchain.
4. Posts And comments
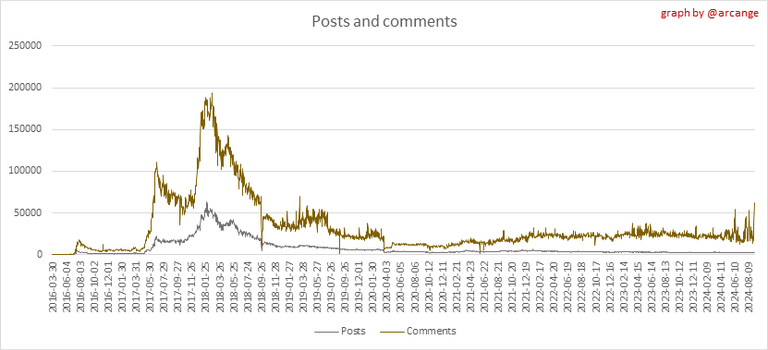 | 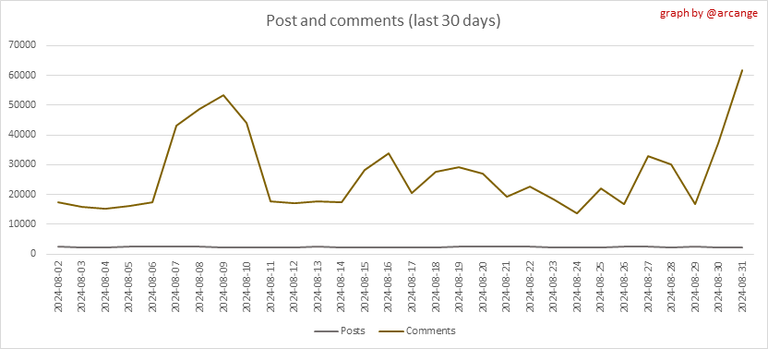 |
These graphs show the evolution of posts and comments for the whole blockchain lifetime and the last 30 days.
5. Curation
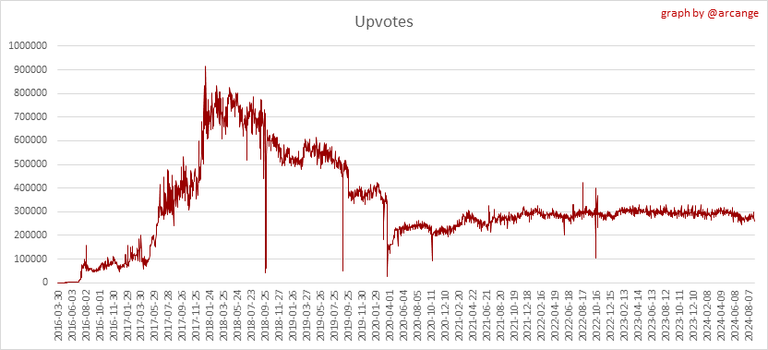 | 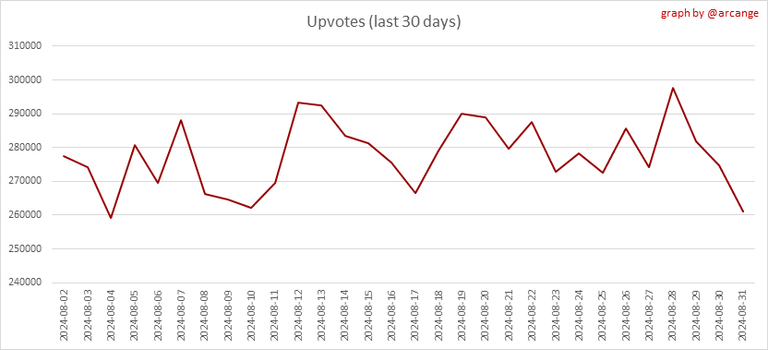 |
These graphs show the evolution of curation (upvotes) for the whole blockchain lifetime and the last 30 days.
6. Daily transactions
![]()
These graphs show the number of transactions per day, and the highest number of transactions per block, the average number of transactions per block, and the number of transactions per block for the last 48 hours. This gives you an idea of the whole activity on the blockchain.
![]()
This graph shows the distribution of the top 10 types of transactions by number of operations performed on the blockchain.
7. Communities and Tags
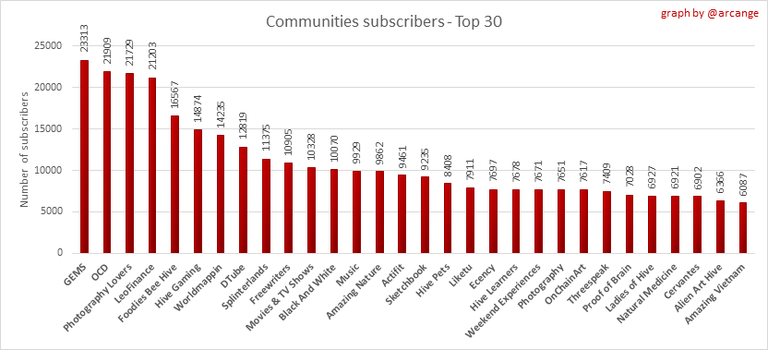
This graph shows the communities with the most subscribers.
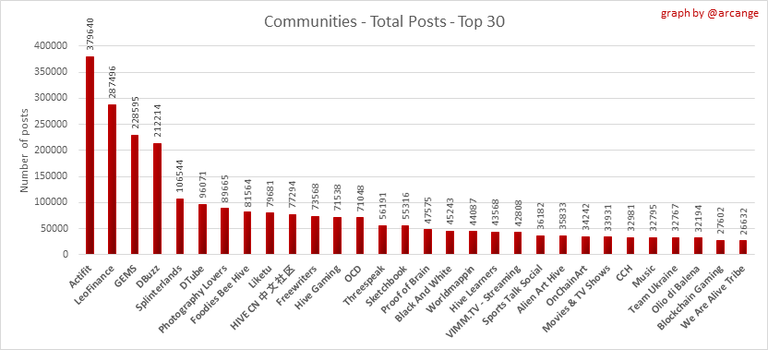 | 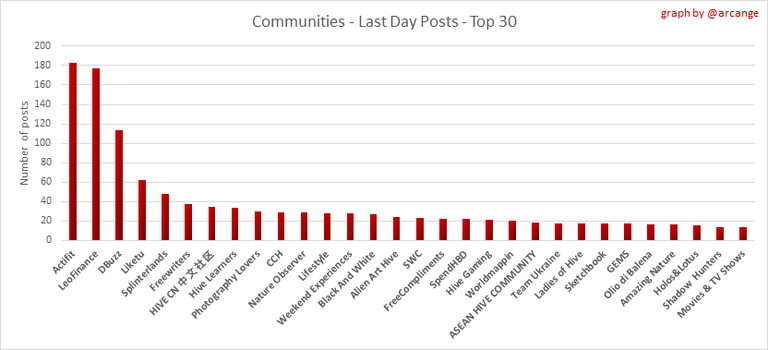 |
These graphs show the most active communities by number of posts (blockchain lifetime and last day).
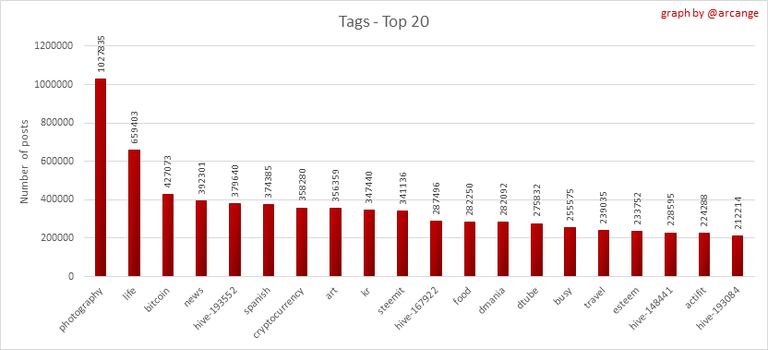 | 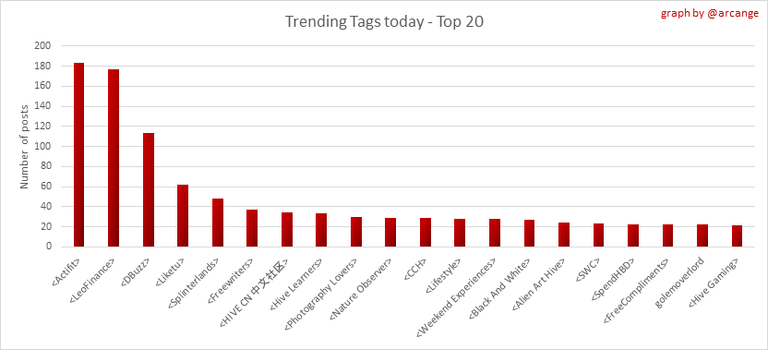 |
These graphs show which main tags have been the most used for publishing posts for the whole blockchain lifetime and the last day.
8. Distribution
 |  |  |  |  |
| < ~585 HP | >= ~585 HP | >= ~5850 HP | >= ~58499 HP | >= ~584983 HP |
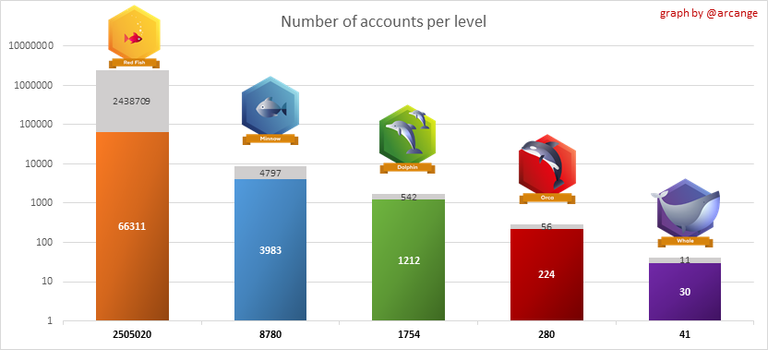 | 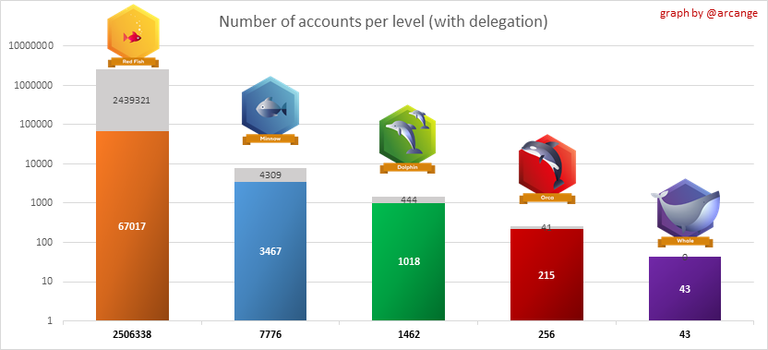 |
These graphs show the number of users according to their Hive Power. The left graph shows the distribution without taking into account any delegation made or received by the accounts. The right graph takes into account delegation, adds received HP delegation and subtracts given HP delegation.
The grey part of each column indicates how many accounts are inactive (those who have not posted, commented or voted the last 30 days).
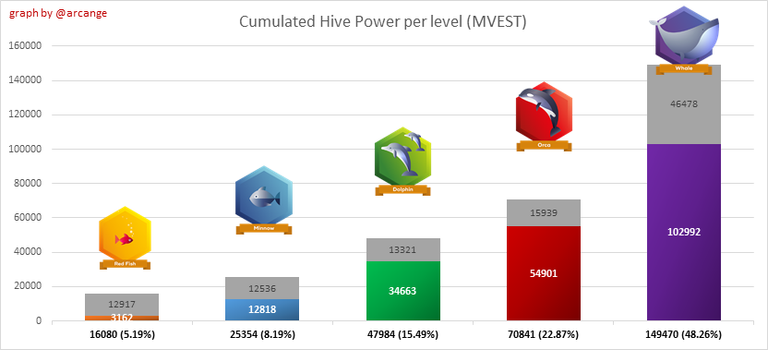 | 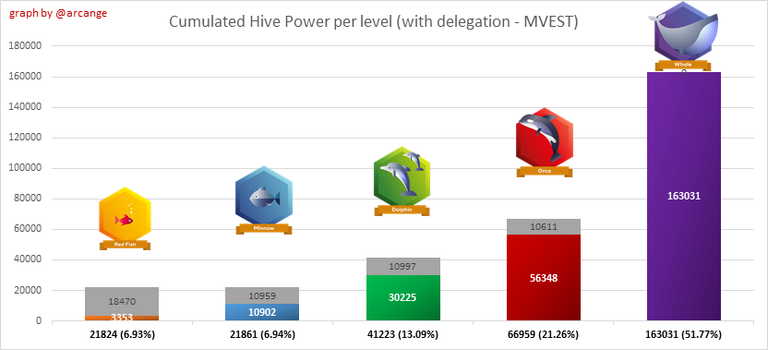 |
This graph shows the distribution of Hive Power cumulated per account level. The left graph shows the distribution without taking into account any delegation made or received by the accounts. The right graphs take into account delegation, adds received HP delegation and subtracts given HP delegation.
The grey part of each column indicates unused Hive Power by inactive accounts (see above the definition of inactive).
Below each column, you will also see a ratio to all existing Hive Power.
9. Payouts
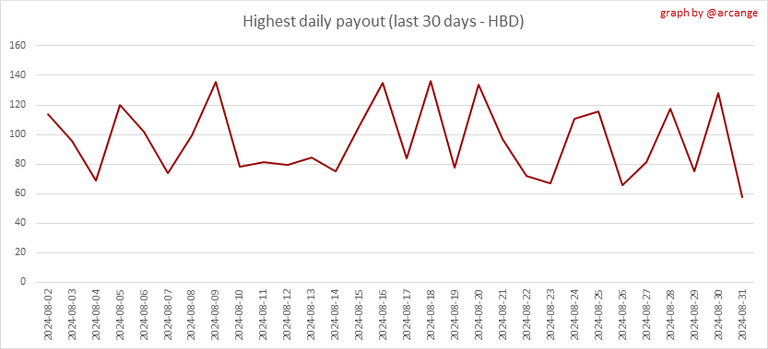
This graph shows the highest reward paid on a post (or comment) for the last 30 days.
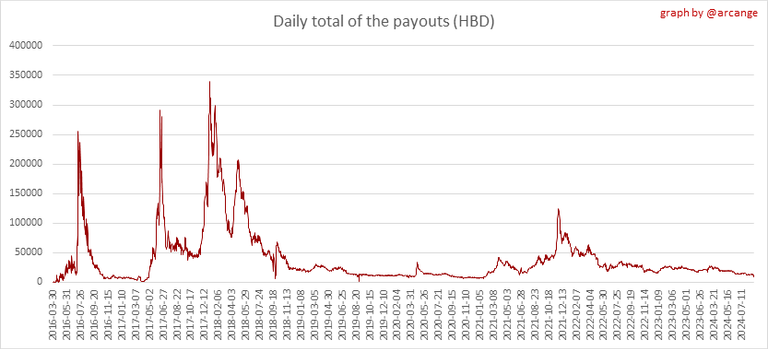 | 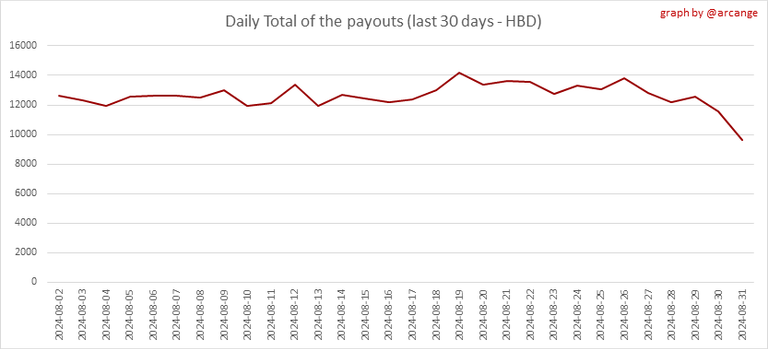 |
These graphs show the total of the distributed payout (posts and comments) for each day.
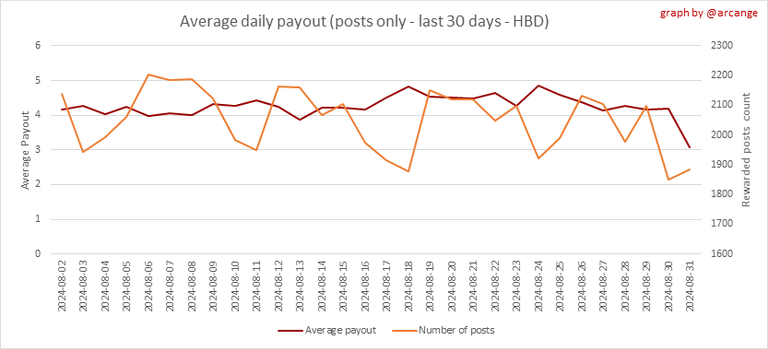 | 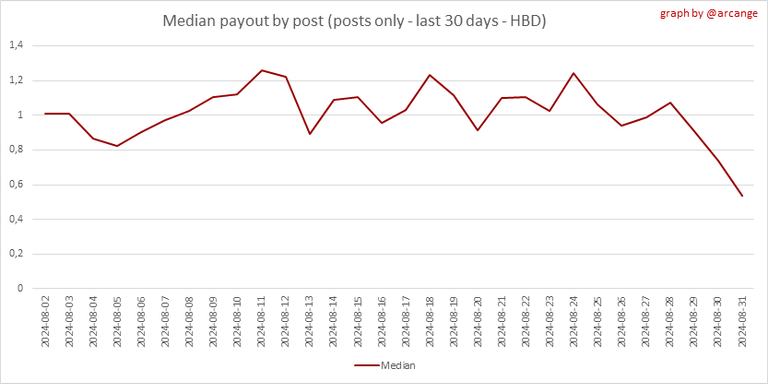 |
These graphs show the average and median payout per post for the last 30 days.
I hope you find those stats useful. If you would like to see additional stats, feel free to drop me a comment. Your feedback is welcome.
Thanks for reading.
Check out my apps and services


Thank you as these stats are important for everyone to see.
I'm glad you find the stats useful. If you have any specific requests or need more detailed information, feel free to let me know!
!BEER
View or trade
BEER.Hey @arcange, here is a little bit of
BEERfrom @pixresteemer for you. Enjoy it!Did you know that <a href='https://dcity.io/cityyou can use BEER at dCity game to buy cards to rule the world.
I don't think there was much benefit from daily stats, but seeing them now and again is useful. I can see that levels of dolphins, orcas and whales are up a little, so people are sticking with it, but we need more growth and have to encourage the minnows.
I agree, a monthly overview will provide a clear and comprehensive picture of Hive's trends and growth. And yes, the increase in dolphins, orcas, and whales indicates a sustained engagement.
Thanks for creating these stats again.
I have already missed them.
You're welcome @blkchn
It’s good to have the stats again
Thank you!
I am happy to benefit from your hard work and skills again. Without these stats it is ineffable how things are going.
Thanks!
Thank you, your support and feedback are much appreciated!
I love that you said ineffable. It's a great word, that leads to great puns, because some things are as F'able as they could possibly be F'd up. But I can't explain it...
Always excellent work from you @arcange , so many people try to publish stats and it's hard to follow some of the data but you have presented the absolutely most relevant numbers using very clear and digestible methods to graph each one.
I am going to say, it's brought me a big old bag of mixed emotions to see these results though.
On one hand, my feelings are validated about the state of affairs here for user activity and population sizes and growth rates and I cannot lie and say I am anything but disappointed to have those personal feelings and observations validated by the data.
On the other hand, I am slightly encouraged to see that at least my personal results in offering new apps and tools to the users of the ecosystem and my efforts to campaign the witness over the last month are at least doing proportionately FAR better than I thought they were, given the meta illustrated here.
Up till now, I kind of thought, wow, my 7 years of reach here ain't reaching any more, and the response to my effort is feeling pretty lackluster.
But actually, it seems that based on what you are showing us here, that given the sheer small amount of activity and usage, I'm actually getting HiveStreams.Live (app) and HiveStreams.net (user tools) and my blog posts in general about them and other things, in front of a LOT of the daily active users.
So, in turn to have 40 or so people sign up for the live streaming platform app in it's first week of existence last week was actually really significant against the total available users who might even care about my offering's niche in the first place.
My app provides twitch style live streaming with some basic hive posting and wallet integrations, so I never expected it to appeal to "everybody here!", I did expect to see more people interested in it and talking about this new option on the chain, than I initially have heard from.
Knowing now that I am actually hearing from a pretty big percentage of "the dailies" is at least letting me know that it's not because nobody cares at all, but more that there is just not so many anybody's even there at all. And of those who are here, word is getting around.
I'm not going to stop building more capability into it just because it is trying to serve such a small audience as far as the social network utilization aspect of Hive goes, and in fact, it was always meant as just another tool in our belts to use ourselves, but it also can serve to entice the "outsiders" to find us and join us.
But I can calm down a little about feeling the sting of slow adoption and awareness, because your numbers against my results lead me to believe its actually performing about as well as it possibly even could here right now.
A takeaway from my lesson for everyone here is KEEP GOING! It may feel like our posts and contributions in any form aren't going very far, or being rewarded like we hoped they might be.
But then you see this and realize that for every outlying $80 post you see from an OG whale type that makes you feel like you aren't reaching your potential, well, those are outliers mostly and there are some ways they achieve those numbers due to "who they know" and sometimes "what they do",
But really, there are a few thousand of us all performing right to the averages with our $2-5 posts and that getting 3 or 4 dozen people to join your new app in a week, or getting a couple hundred blog upvotes, even if they don't add up to much financially due the scaling of wallet size/account quantities we are being shown here, is actually a solid accomplishment in an overall potential audience of this modest size, and not a failure to launch at all!
Heck, I'd love to see this broken down one more level. Language. If you crawl around the place, you'll find huge pockets of Spanish speaking communities, other languages doing their things, and then the sort of "mainstream" stuff in English across all of it.
This is relevant because for example, if there are a hypothetical 1000 total users and 500 operate here in only Spanish, 100 only Japanese, 100 speak various other languages, and these have a certain percentage that do not in turn union set on English, than maybe you aren't even able to EVER reach the whole place, only those that operate in the language you choose to use here.
So that makes small successes like I've been discussing so far, even BIGGER if viewed in regard to the size of your publishing language's subset of the total platform potential audience.
Summarizing this, these are some pretty encouraging disappointing numbers!
You, yes you, dear reader of this comment, whomever you may be, your blog doesn't suck! Your app isn't failing! We just need to get you some more eyeballs to even see it! If you get any reaction at all, you probably reached a sizeable amount of the available potential after all!
So Way To Go, You! Keep up the good work!
Thank you for your comment! It's nice to see a nuanced understanding of the data presented.
Your analysis about language barriers is spot-on. Breaking down these statistics by language could indeed provide further valuable insights. However, I previously tried my best to consider each non-English-speaking community by translating my posts in different languages but this has not always been appreciated.
I just appreciate the view of the data at any useful level, which all this very much is already, as it is here in present form.
Thanks again for it.
Interesting post there. Just looking at new users daily on that bar chart. It states active and inactive new users,. Take the first day we have 165 new users. 63 of them are in active. What does that mean? They did not post or perform a json transaction?
Wow, I had no clue that there are just 1754 dolphin account on Hive. I expected that number to be much higher. I hope to see monthly updates of this to compare, that would be cool..
I'll continue providing these monthly updates so we can track the changes together. Stay tuned!
Great, I will tune in to stay informed!