HMSTR/USDT Chart Analysis
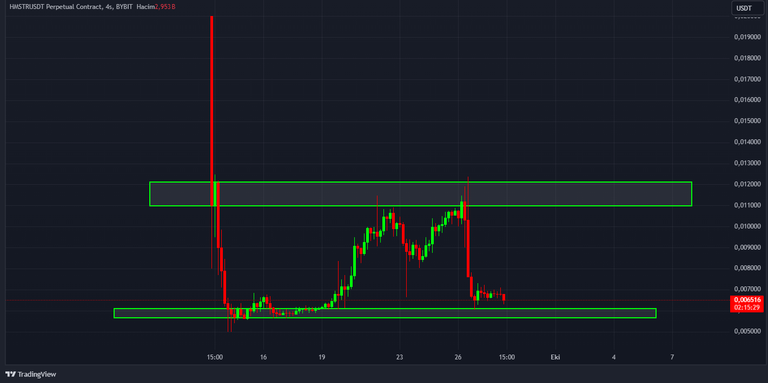
Hello everyone. I hope you are well. Hamster Kombat (HMSTR) was listed simultaneously on many exchanges on September 26. Since there is no expectation that "its price will increase when it is listed on Binance Exchange" in the future, a very healthy price formation took place. I will share the charts related to the Hmstr token using Binance Exchange data. However, Bybit Exchange announced that it converted its pre-market sales data into futures of the same parity. Since there is more data, I will first share the screenshot I took from the Bybit HMSTRUSDT.P chart. The data is in the 4-hour time frame. I got it from Tradingview.

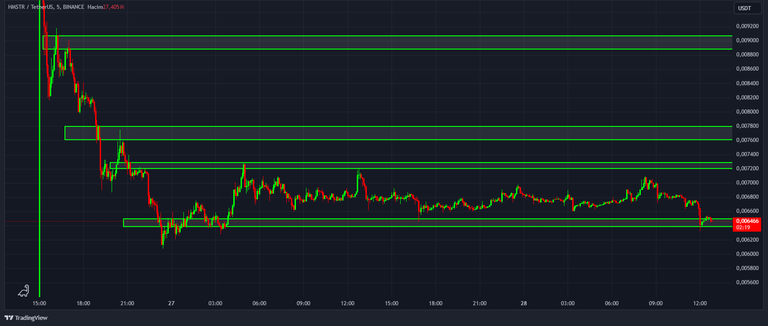
The supply-demand zone below It passes through the price range of 0.006-0.0055. The supply-demand zone above is in the price range of 0.011-0.0121. The chart below is from Binance Exchange's HMSTR/USDT pair. The screenshot is also taken from Tradingview. The data is from a 5-minute time frame. 
The supply-demand zone below is in the price range of 0.00649-0.00638. The supply-demand zone above is in the price range of 0.0072-0.00728. I will not mention the supply-demand zones above. You can learn the relevant high supply-demand areas by marking the areas on the chart you use.
The HMSTR token was offered from a fairly new project. A large airdrop was made. For such reasons, it involves a lot of risk. I do not give investment advice. It would be more useful to see this information as an educational study. See you. Stay tuned.
Posted Using InLeo Alpha

Congratulations @anadolu! You have completed the following achievement on the Hive blockchain And have been rewarded with New badge(s)
Your next target is to reach 64000 upvotes.
You can view your badges on your board and compare yourself to others in the Ranking
If you no longer want to receive notifications, reply to this comment with the word
STOPCheck out our last posts: