X Blue Metrics Report, August 19 2024
I'm making my slow climb back to my normal on X. I've seen my 7-day impressions over 3,000 and my 7-day engagements over 8%. This week, most of my stats are up, and I'm kicking my heels together. This is what my X metrics look like.
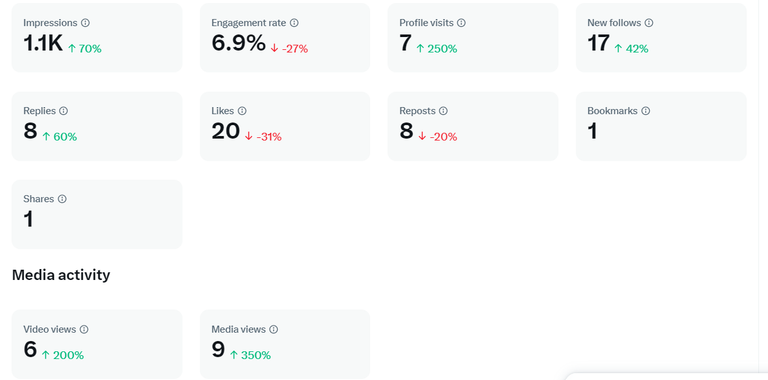
Impressions are up 70 percent and at 1.1 thousand for the week. Not too shabby since they were around the 600 mark last week. The Engagement rate is down 27 percent but still at 6.9 percent, which is high compared to my weekly norm.
Other metrics on the upswing this week include:
- Profile visits (up 250 percent to 7; awesome!)
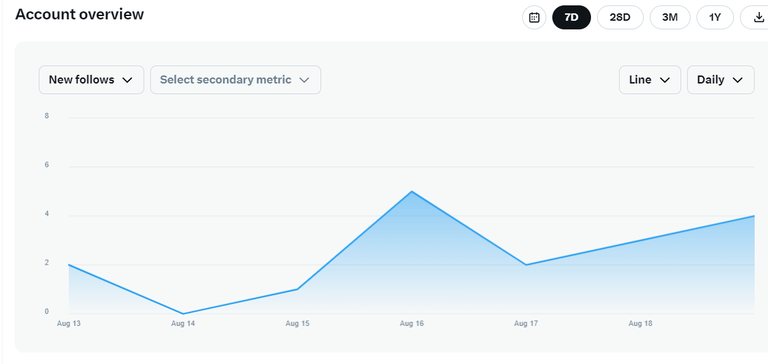
- New follows (up 42 percent to 17; yeah, I picked up a lot of new followers this week - huah!)
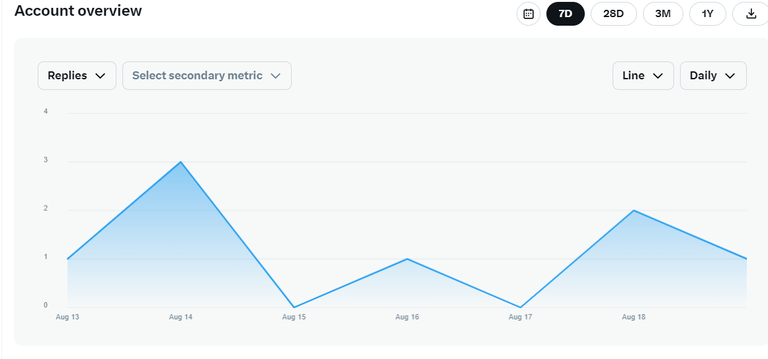
- Replies (up 60 percent to 8)
- Video views (up 200 percent to 6)
- Media views (up 350 percent to 9)
The metrics on the downswing are:
- Likes (down 31 percent to 20)
- Reposts (down 20 percent to 8)
More ups than downs. That's a pretty cool roller coaster ride!
Impressions and Engagements
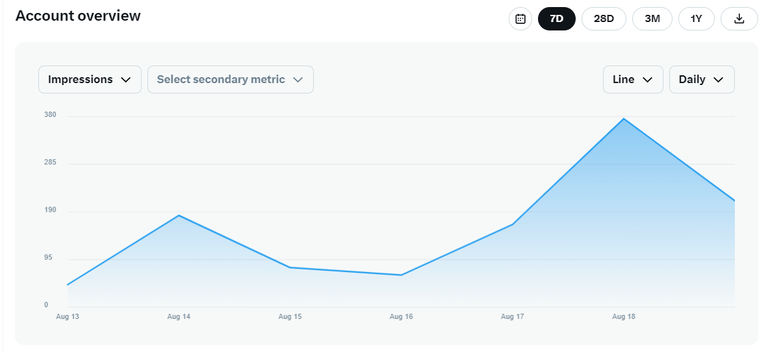
Impressions peaked yesterday, August 18 at 376. The picture makes for a nice summit with a little valley in the middle of the week. Wednesday, August 14 saw 183 impressions.
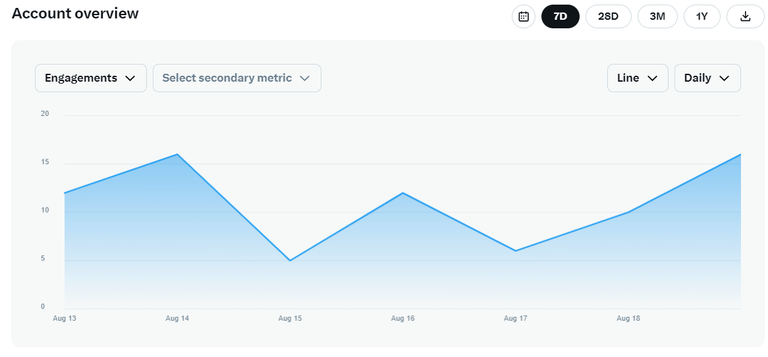
Engagements had dual peaks this week. One on August 14 and one today, August 19. Both reached a high of 16 total engagements. That's a pretty picture.
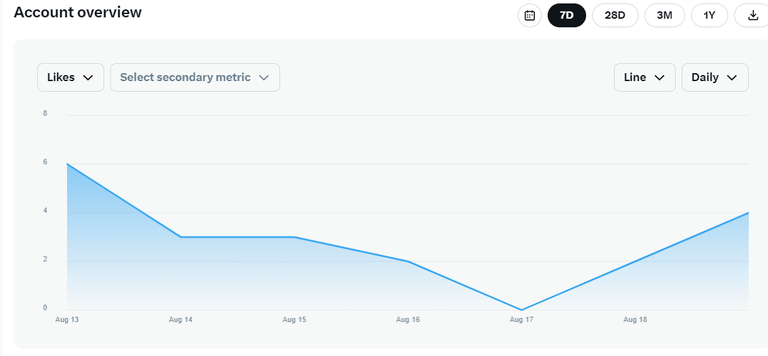
Likes peaked on Tuesday, August 13 but made a decent comeback this morning.
New follows peaked on Friday, August 16 and had a nice little comet tail at the end of the week.
Replies shook the mountain on August 14 and followed with a couple of hills later in the week.
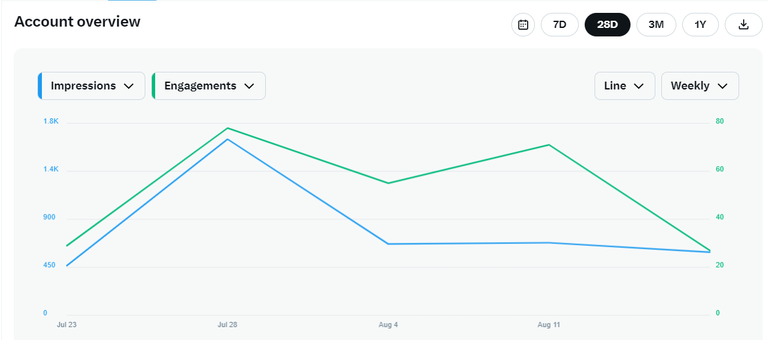
28-Day Picture
Looking back over the last 28 days, I thought I'd compare impressions with engagements. The weekly picture shows them mostly in parallel, rising and falling together with only one exception. That one exception was from August 11 to August 17 when engagements rose slightly and impressions remained nearly linear. The truth is, there was a slight decline in impressions, but it was so slight that it's hardly noticeable.
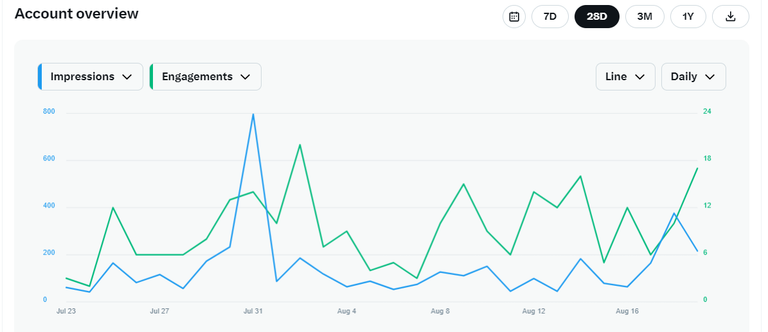
That was the weekly picture. Let's look at the daily metrics over the same period. In this graph, we can see a little correlation in the movements between the two metrics. It appears that engagements follow the trajectory of impressions, which is something I like to see.
That concludes my report for this week. I'm looking forward to next week's report already.
Follow my #aphorism tweets daily on X. Vote on whether I should change the hashtag to #laphorism right here.
Posted Using InLeo Alpha
Congratulations @allentaylor! You have completed the following achievement on the Hive blockchain And have been rewarded with New badge(s)
Your next payout target is 3000 HP.
The unit is Hive Power equivalent because post and comment rewards can be split into HP and HBD
You can view your badges on your board and compare yourself to others in the Ranking
If you no longer want to receive notifications, reply to this comment with the word
STOP