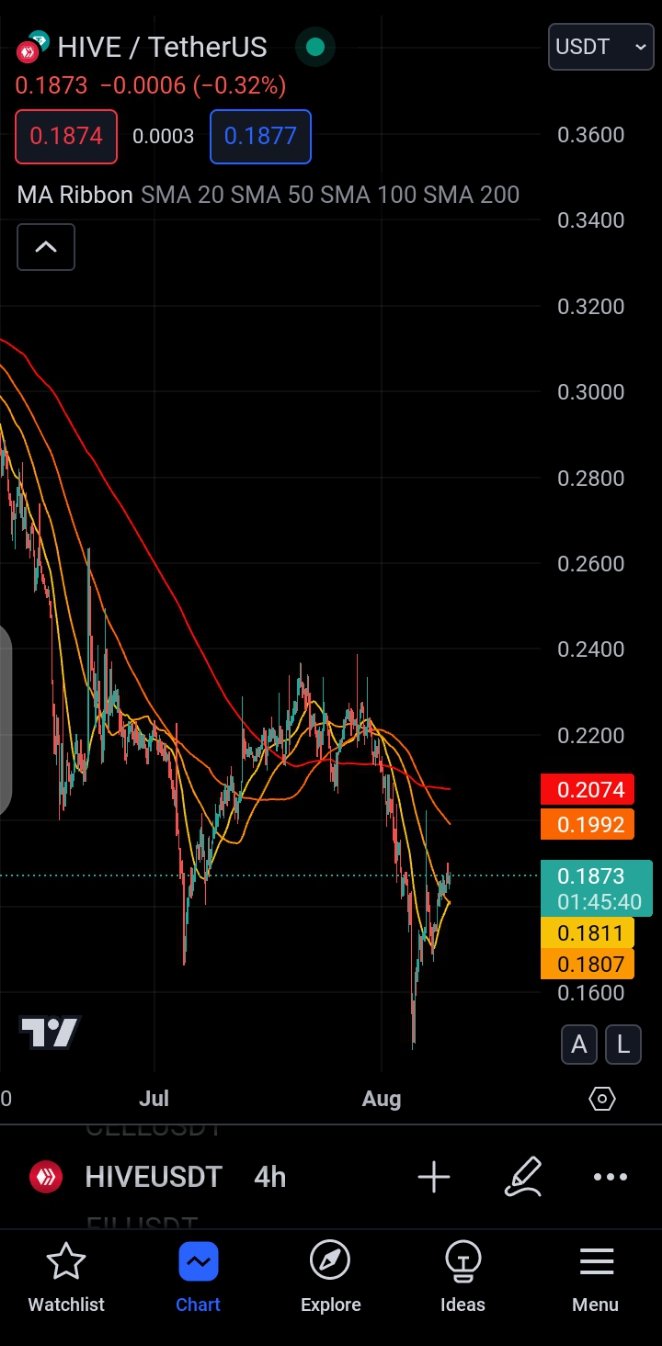
Understanding moving averages 🤔

Moving averages (MAs) are a fundamental tool in technical analysis, used to smooth out price data and identify trends over a certain period of time. They help traders filter out the noise from random short-term price fluctuations and see the underlying trend.
Types of Moving Averages 😃
Simple Moving Average (SMA):
- The SMA is calculated by taking the average of a set of prices over a specific period. For example, a 10-day SMA averages the prices of the past 10 days.
.
- The SMA is calculated by taking the average of a set of prices over a specific period. For example, a 10-day SMA averages the prices of the past 10 days.
Exponential Moving Average (EMA):
- The EMA gives more weight to recent prices, making it more responsive to new information. This makes it quicker to react to price changes compared to the SMA.
- Weighted Moving Average (WMA):
- Similar to the EMA, the WMA assigns more importance to recent prices, but it does so in a linear fashion, assigning a weight to each price point based on its age.
Key Uses of Moving Averages
Trend Identification:
- Moving averages help identify the direction of the trend. When prices are above the MA, it generally indicates an uptrend, and when below, it indicates a downtrend.
Support and Resistance Levels:
- MAs often act as support in an uptrend or resistance in a downtrend. Prices might bounce off these levels.
Crossover Signals:
- A common trading strategy is the crossover technique, where a shorter-term MA crosses above a longer-term MA (a bullish signal) or below it (a bearish signal). For example, a 50-day SMA crossing above a 200-day SMA is considered a "Golden Cross" (bullish), and the opposite is a "Death Cross" (bearish).
Smoothing Data:
- MAs smooth out price data, making it easier to see trends and patterns that are not as obvious with raw data.
Moving Average Periods
- Short-term MAs (5-20 periods) are more sensitive to price changes and are often used to catch short-term trends.
- Medium-term MAs (20-50 periods) are used to identify mid-term trends.
- Long-term MAs (50-200 periods) are used to identify long-term trends and are less sensitive to short-term price fluctuations.
Limitations
- Lagging Indicator: Since MAs are based on past prices, they lag behind the market and may not predict future price movements effectively.
- Whipsaw Effect: In volatile markets, MAs can produce false signals, causing traders to enter or exit trades prematurely.
Understanding and correctly applying moving averages can be a powerful tool in your trading strategy, helping you make more informed decisions in the market.
Do you use moving averages when analyzing charts 📈?
NB: This post is for educational purposes alone. I'm not a financial advisor. Trade responsibly😉
I'll catch you on the next one.
0
0
0.000
0 comments